
by Chris Kimble | May 20, 2014 | Kimble Charting
CLICK ON CHART TO ENLARGE When was the last time the S&P 500 fell 15%? It’s been three years! Speaking of three years, three years ago this past week the Power of the Pattern shared that the world was creating look alike bearish patterns at...
by Chris Kimble | Apr 11, 2014 | Kimble Charting
CLICK ON CHART TO ENLARGE Three years ago I did a post titled “Look Alikes, Dominoes and Slipper Slides” which highlighted that the key stock markets around the world were all creating bearish rising wedge patterns. (see post here) Check out...

by Chris Kimble | Apr 3, 2012 | Kimble Charting
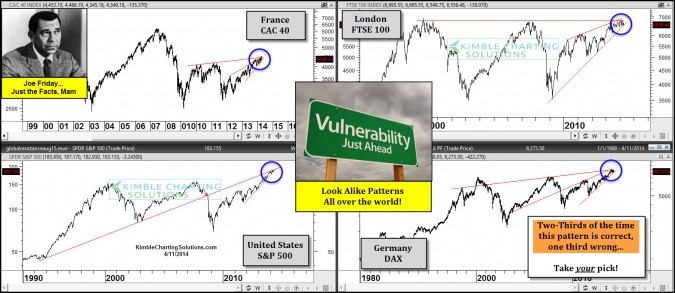
On 5/14/2011 the 6-pack below was posted, as the “Power of the Pattern” was reflecting - multi-year bearish rising wedges were taking place around the world and rising wedges two-thirds of the time results in lower prices (see 5/14 post here) . The...

by Chris Kimble | Jan 13, 2012 | Kimble Charting
Last May the “Power of the Pattern” was reflecting the following situation in the 6-pack below….Global markets were all looking alike, creating bearish rising wedges and that if one support line was to break, they all should, due the the high...
by Chris Kimble | Sep 30, 2011 | Kimble Charting
Shared the chart below back in May, reflecting that a multi-year flag/pennant pattern was breaking to the downside in the Shanghai index (see post here) The last line in the 5/25 post was…”the impact could be huge!” CLICK ON CHART TO...

by Chris Kimble | Sep 12, 2011 | Kimble Charting
They say if you like Sausage, “you shouldn’t watch it being made, due to its an ugly process.” Speaking of Ugly, the Wilshire 5000 had created an ugly pattern, first published on 7/27 (see post here), prior to a very Ugly month of...

by Chris Kimble | Sep 2, 2011 | Kimble Charting
On May the 14th, I shared that the world was at risk due to two key reasons…(1) Bearish rising wedges had formed around the globe and (2) Correlation risk was extremely high! (see post here) The “Power of the Pattern” was suggesting...

by Chris Kimble | Aug 16, 2011 | Kimble Charting
I wanted to revisit the message of the “Power of the Pattern” 90 days ago, in an attempt to help us going forward. The 6-pack below was a “global snapshot reflecting look alike bearish rising wedges….before a breakdown...
