by Chris Kimble | Jan 28, 2022 | Kimble Charting
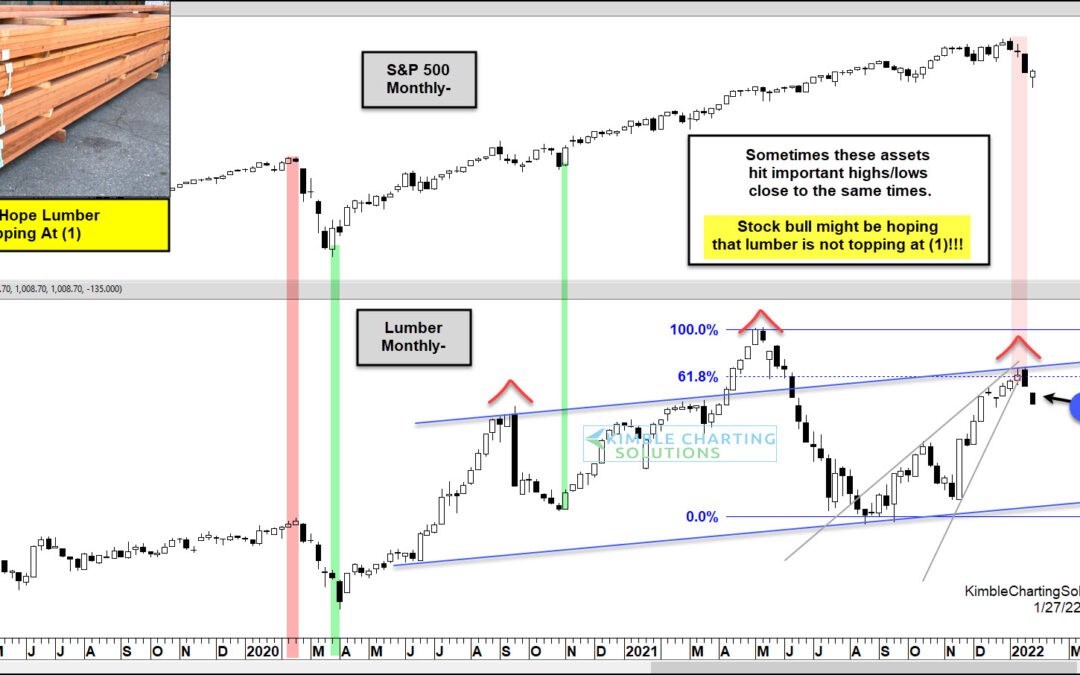
The supply chain has dealt with several issues over the past couple of years, as consumers and businesses have been forced to navigate a tricky “COVID” landscape. Commodity prices (in general) have risen, while enduring some big swings. Today we look at a commodity...
by Chris Kimble | Sep 15, 2021 | Kimble Charting
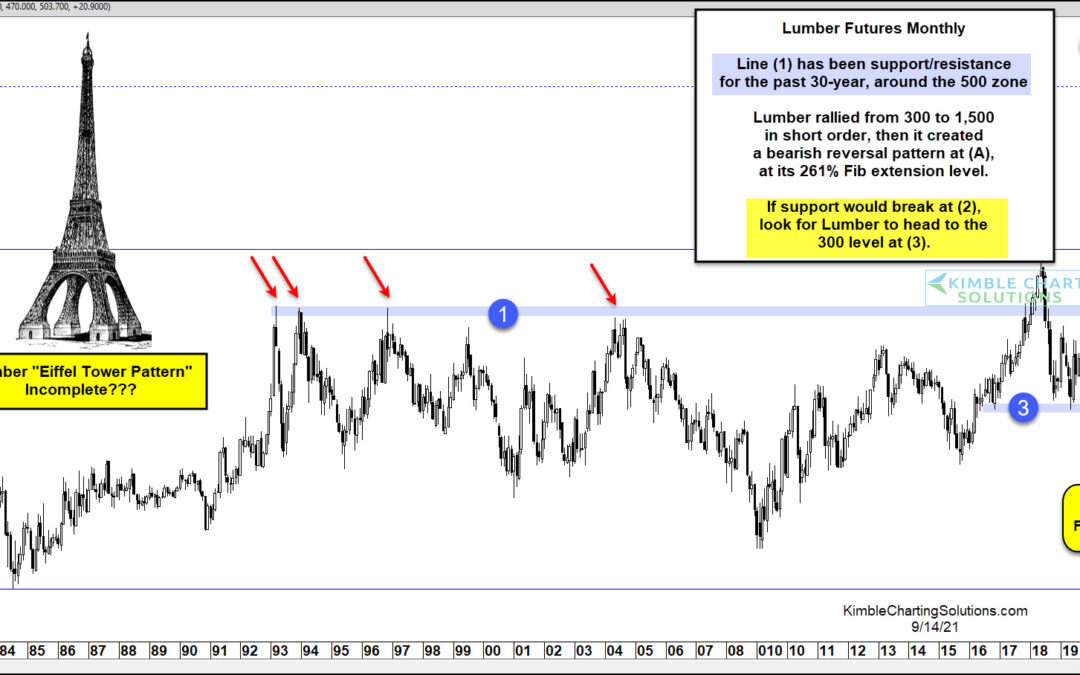
One of the over-looked commodities and economic indicators is Lumber. And more specifically the price of lumber. The price of lumber has been on the rise since the 2008 financial crisis, but Lumber futures prices went haywire following the onset of COVID in the spring...
by Chris Kimble | Jun 3, 2021 | Kimble Charting
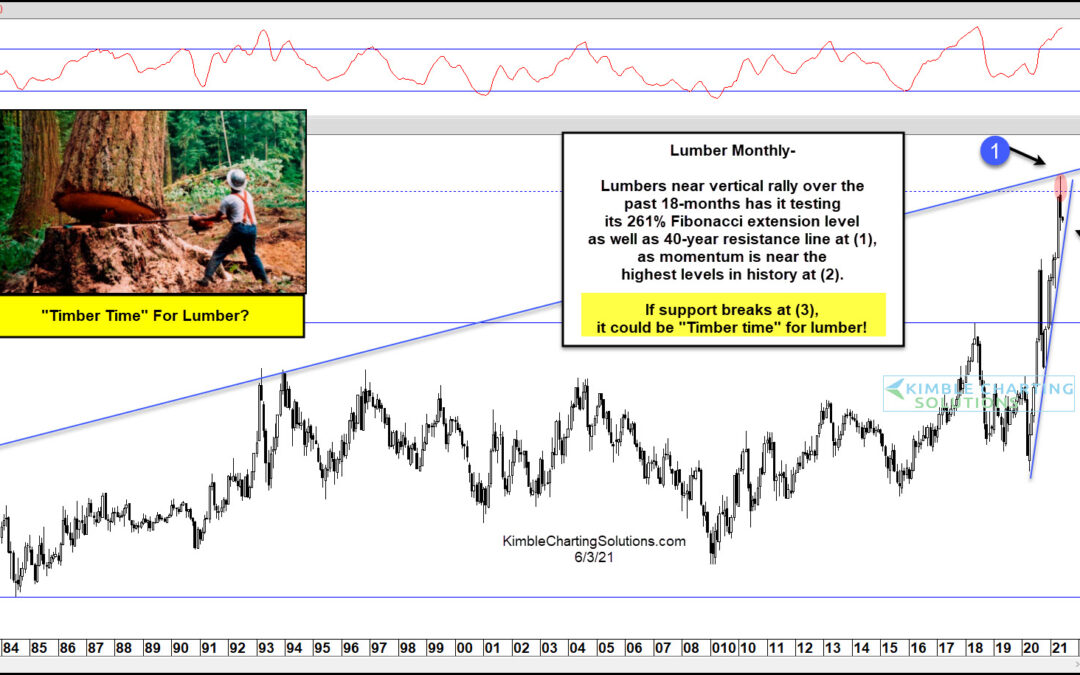
Rising lumber prices have been a major source of inflation concerns. It’s one thing when the price of lumber doubles… and a whole other thing when it goes up 5-fold! Yep, that’s right. Lumber prices have rocketed higher over the past 18 months, surging 5 times the...
by Chris Kimble | Jun 13, 2019 | Kimble Charting
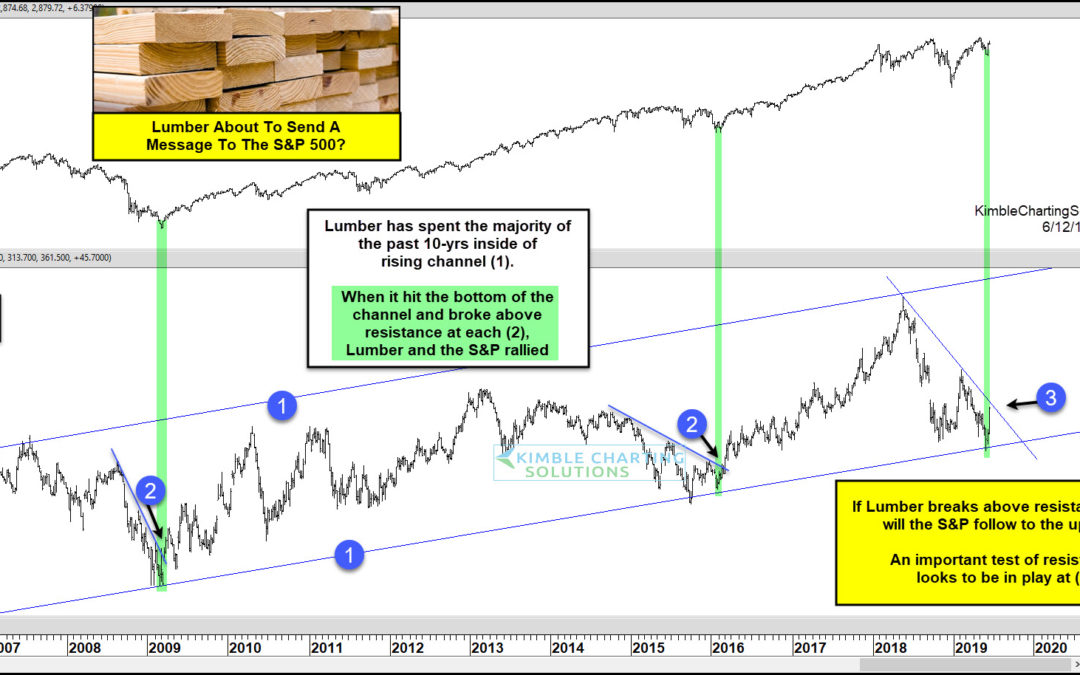
For the past decade, Lumber prices have traded within a broad rising trend channel. See (1) on the lumber “weekly” price chart above. Recently lumber prices hit the bottom of that channel and began to bounce higher. This could be good news for the S&P 500 Index...
by Chris Kimble | Sep 24, 2018 | Kimble Charting
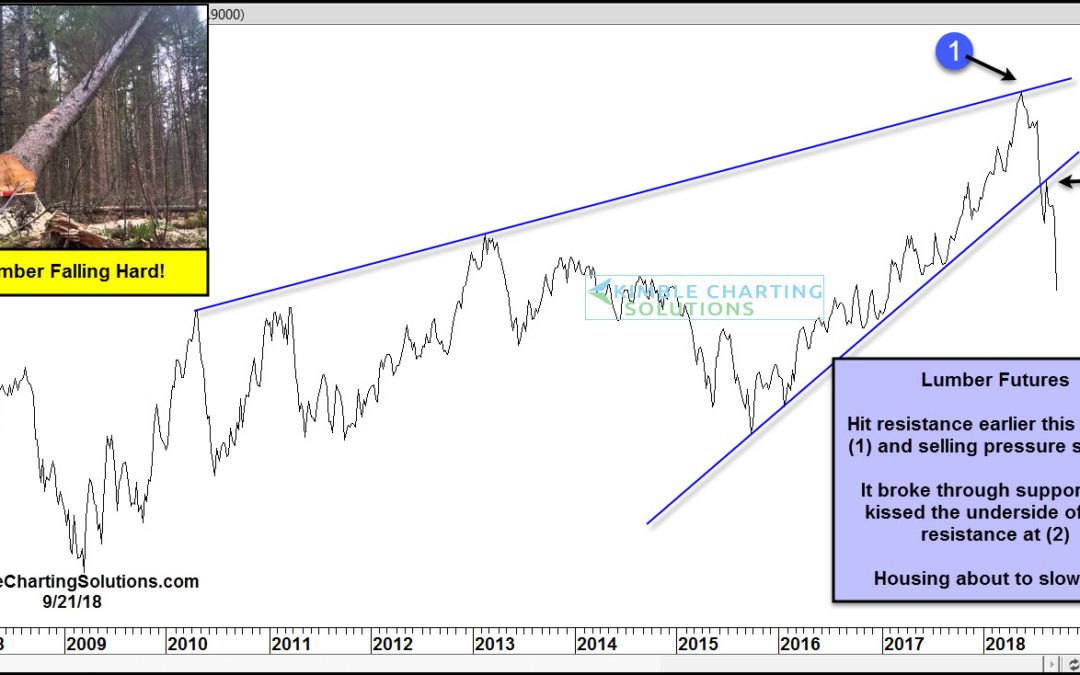
CLICK ON CHART TO ENLARGE Home and Lumber prices can send important messages to how the economy is doing. The chart above looks at Lumber prices over the past 11-years. So far this year, Lumber and the DJ Home Construction index is diverging against the broad market....
by Chris Kimble | Aug 3, 2018 | Kimble Charting
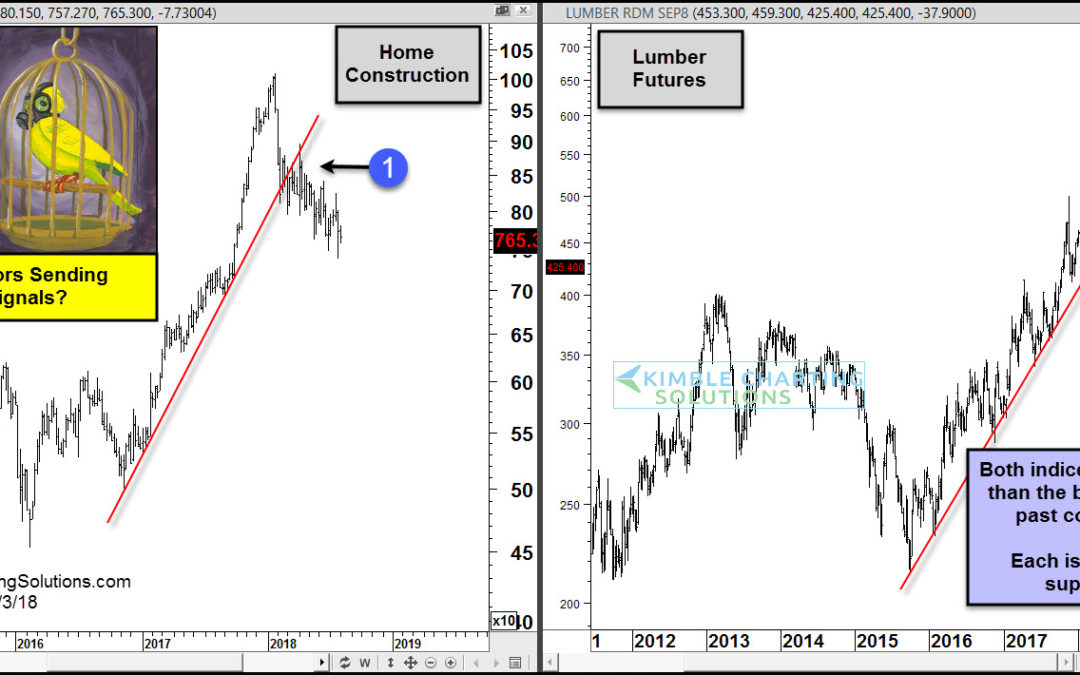
CLICK ON CHART TO ENLARGE Over the last 30-months, Lumber and Homebuilders have been much stronger than the S&P 500. Both were upside leaders as Homebuilders gained 50% more than the S&P and Lumber doubled S&P gains since 1/1/16 Not only did they...
by Chris Kimble | May 23, 2018 | Kimble Charting
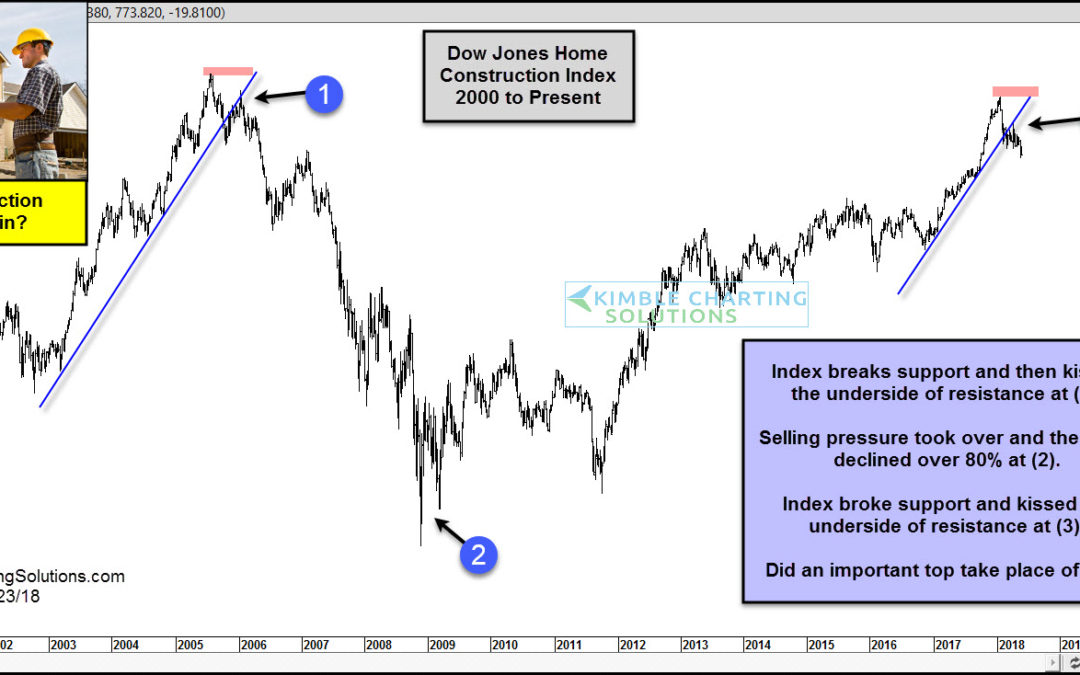
CLICK ON CHART TO ENLARGE Few industries are more important to the overall economy than the Housing Sector. The chart above looks at the Dow Jones Home Construction Index over the past 18-years and how it has peaked and bottomed ahead of the broad markets in the past....

by Chris Kimble | Jan 15, 2014 | Kimble Charting, Sector / Commodity
CLICK ON CHART TO ENLARGE Ever heard of the idea of buy low & sell higher? Believe in it? If not quit reading now! If you do believe in the idea of buy low & sell higher or believe in buying assets that are out of favor, the above chart might be of...
