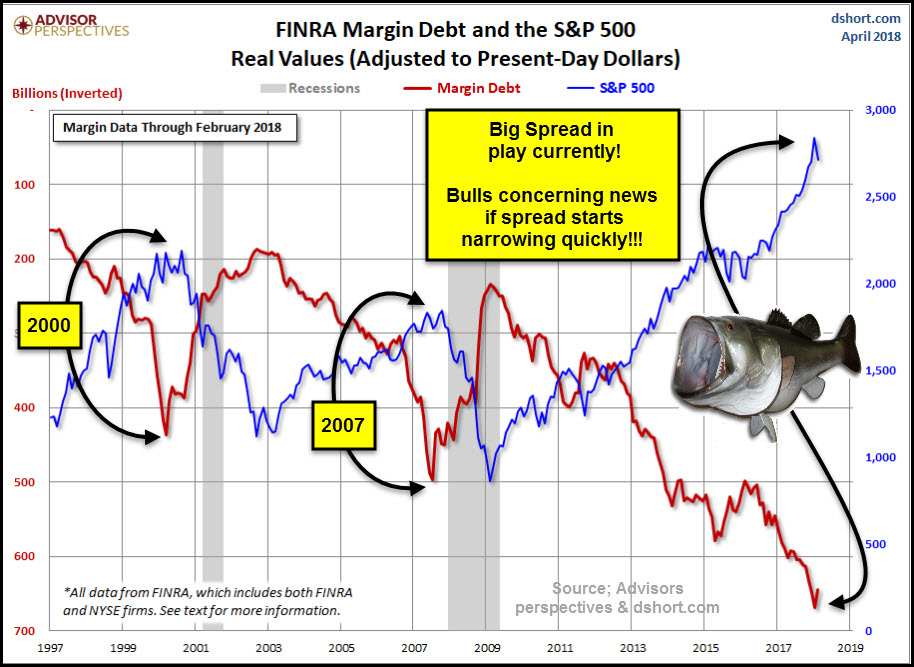
by Chris Kimble | Apr 4, 2018 | Kimble Charting
CLICK ON CHART TO ENLARGE This chart from Advisors Perspectives/dshort.com looks at the S&P 500 and margin debt (inverted) over the past 20-years. When the spread was wide back in 2000 & 2007 and started narrowing (investors reducing margin exposure), stocks...
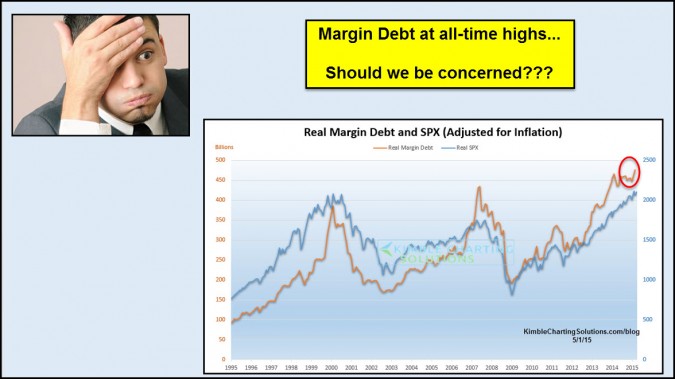
by Chris Kimble | May 4, 2015 | Kimble Charting
CLICK ON CHART TO ENLARGE Margin Debt of late hit all-time highs, surpassing levels reached in 2000 and 2007, should we be concerned? In the long-term, margin debt at these levels will most likely become an issue that will impact markets, possibly like it has in the...

by Chris Kimble | May 22, 2014 | Kimble Charting
CLICK ON CHART TO ENLARGE Margin debt reaching all-time highs can be viewed as a sign of excessive confidence in the markets, yet knowing this hasn’t been really that helpful when it comes to portfolio construction. What has happened in the past...

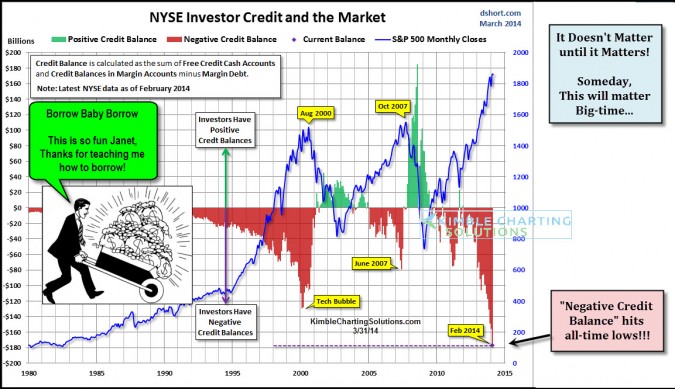
by Chris Kimble | May 1, 2014 | Kimble Charting
CLICK ON CHART TO ENLARGE It doesn’t matter until it matters! Will a decline in margin debt from all-time highs matter this time? Doug Short each month does an excellent analysis on margin debt and the latest update is now out. (see current info...
by Chris Kimble | Apr 1, 2014 | Kimble Charting
CLICK ON CHART TO ENLARGE Margin Debt took a giant leap over this year, rocketing to new all-time highs! Doug Short shares updated Margin Debt data (HERE) As I shared above…”It doesn’t Matter….Until it Matters!” Some day this...

by Chris Kimble | Jan 29, 2014 | Kimble Charting
CLICK ON CHART TO ENLARGE New data is out, reflecting that margin debt has increased, reaching the highest levels in all of history. Current data now reflects that margin debt has recently surpassed levels hit in 2000, at the height of the Tech bubble.Doug Short...
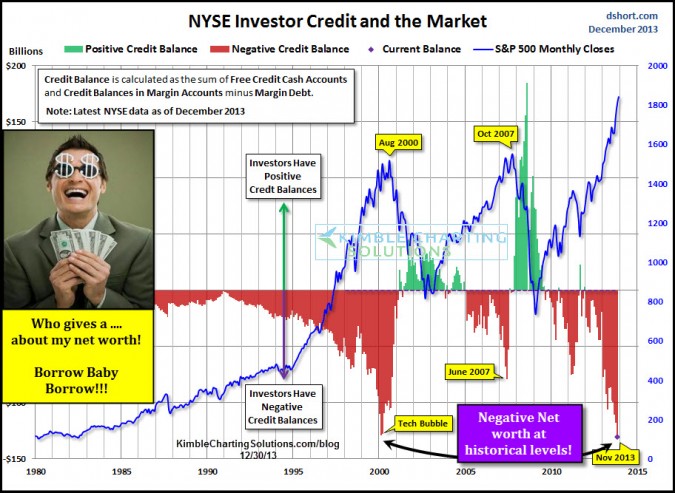
by Chris Kimble | Dec 30, 2013 | Kimble Charting
CLICK ON CHART TO ENLARGE Margin Debt/Negative net worth of individual investors is now hitting levels only reached at the height of the Tech bubble back in 2000! Doug Short produces outstanding work and he does it again as he keeps investors updated with a...

by Chris Kimble | Sep 25, 2013 | Kimble Charting
CLICK ON CHART TO ENLARGE The latest figures on NYSE margin debt were just released and they reflect total margin debt and negative net worth of investors remains near historic highs, only surpassed by the debt levels reached in 2000. The above chart, created by Doug...
