
by Chris Kimble | Aug 23, 2013 | Kimble Charting
CLICK ON CHART TO ENLARGE When investors get cocky, they end up borrowing money to invest in the stock market, via margin accounts. The above outstanding chart, created by Doug Short, reflects that margin debt remains near record levels. Why could this be...

by Chris Kimble | Jun 28, 2013 | Kimble Charting
CLICK ON CHART TO ENLARGE Does the 1982, 2002, 2003 closing lows and the 1987, 1999 and 2007 closing highs have something in common? Yes! They are emotional extremes, Key highs and lows in the Dow since President Reagan was in office. Joe Friday….The...
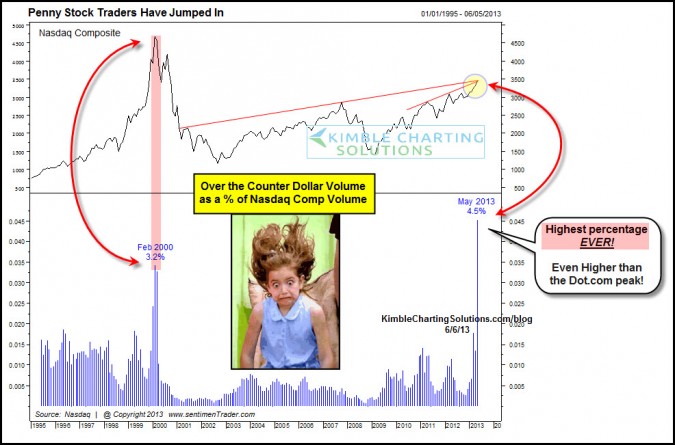
by Chris Kimble | Jun 11, 2013 | Kimble Charting
CLICK ON CHART TO ENLARGE Penny stock volume as a percentage of Nasdaq volume became a very large percentage back in Feb of 2000, reflecting that a high level of speculative trading was taking place. In the next few years the Nasdaq 100 lost over 80% of its value!...

by Chris Kimble | May 31, 2013 | Kimble Charting
CLICK ON CHART TO ENLARGE The NYSE made an important high 5 years ago this month and then proceed to waterfall in price. Now the rally in the NYSE has it back to that important high, in the same month, 5 years later. At the same time several key emotional highs and...

by Chris Kimble | May 24, 2013 | Kimble Charting
CLICK ON CHART TO ENLARGE Sir John Templeton first alerted me to the dangers of excess margin debt in the late 1990’s and I’ve been a fan of keeping in touch with this key indicator ever since. Fresh Margin debt numbers have just been released. My...
