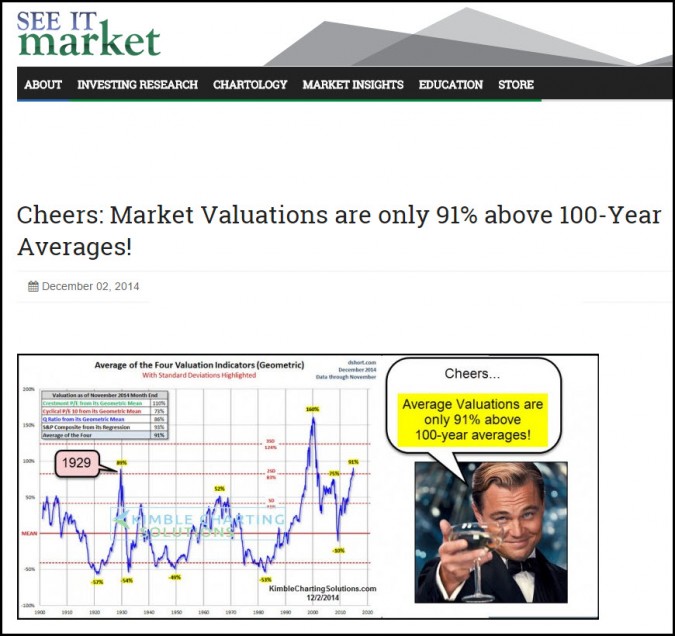
by Chris Kimble | Dec 2, 2014 | Kimble Charting
CLICK HERE TO SEE ARTICLE Average valuations are currently only 91% above 100-Year averages right now. See It Market shares this chart and the unique situation that the Russell 2000 & Mid-Cap 400 are facing right now. See article and charts…...
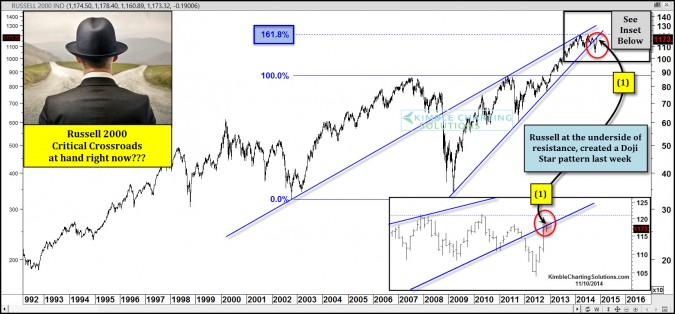
by Chris Kimble | Nov 10, 2014 | Kimble Charting
CLICK ON CHART TO ENLARGE Don’t underestimate the importance of what the Russell 2000 does from here! Almost a month ago, small caps found themselves very oversold, on support and poised for a rally. I shared why the Power of the Pattern thought they were...
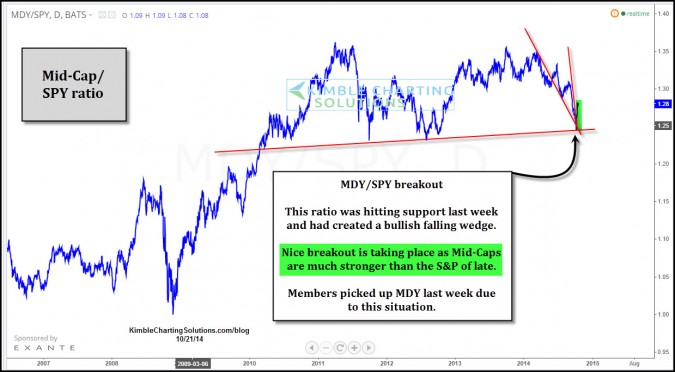
by Chris Kimble | Oct 21, 2014 | Kimble Charting
CLICK ON CHART TO ENLARGE I shared last week with Premium members that the Mid-Cap/SPY ratio appeared to be oversold, at support and looked to be creating a bullish falling wedge, which was a good place to go long MDY with a stop below support. At the same time...

by Chris Kimble | Sep 29, 2014 | Kimble Charting
CLICK ON CHART TO ENLARGE The Russell 2000 & Mid-Cap 400 happened to bottom together in the fall of 2008, ahead of the S&P 500, sending a bullish signal to the broad markets. Turning the page forward, they both started started reflecting weakness...

by Chris Kimble | Sep 5, 2014 | Kimble Charting
CLICK ON CHART TO ENLARGE Small and Mid Caps monthly momentum is reaching lofty levels, last seen in 2007. At the same time both are hitting Fibonacci 161% extension levels based upon their 2003 lows and 2011 highs as a resistance line off the 2003 lows is...

by Chris Kimble | Aug 1, 2014 | Kimble Charting
CLICK ON CHART TO ENLARGE The above 2-pack highlights that the Russell 2000 and Mid Cap 400 ratios against the S&P 500 could be breaking support dating back a decade. The Power of the Pattern highlighted this past weekend the rare situation that was taking...

by Chris Kimble | Apr 25, 2014 | Kimble Charting
CLICK ON CHART TO ENLARGE These almost mirror image charts has my attention. Is a Head & Shoulders top taking place in the Russell 2000, in the inset box on the left? Premium Members established a short position in the Russell as it was at the top of...

by Chris Kimble | Jun 21, 2013 | Kimble Charting
CLICK ON CHART TO ENLARGE The Dow declined 353 points yesterday, wiping out 6 weeks worth of gains. The decline has become a major focus of the media. Did the decline break support levels from where the rally started in the fall of 2012? Joe...
