by Chris Kimble | May 1, 2013 | Kimble Charting
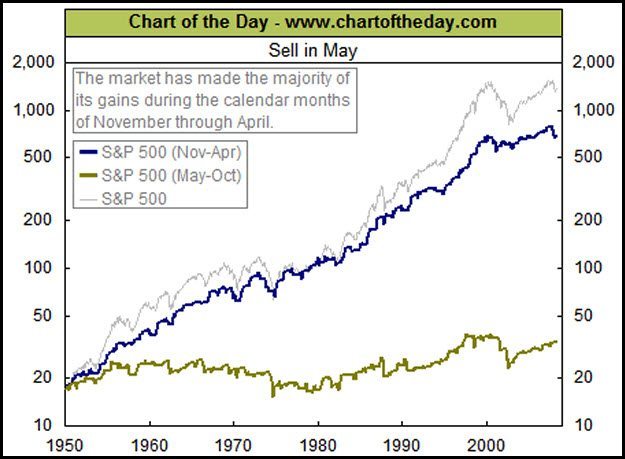
Happy May Day! This time of year causes Wall Street to bring up the “Sell in May and go away” investment strategy. This strategy suggests that the majority of the gains in the S&P500 take place between October and May of each year. CLICK ON...
by Chris Kimble | Nov 11, 2011 | Kimble Charting
Shared pre-market Monday morning that the markets action would revolve around the news from Europe (see post here) See update to that post at the end of the week… CLICK ON CHART TO ENLARGE So whats new today compared to Monday morning? Not...
by Chris Kimble | Nov 4, 2011 | Kimble Charting
On 10/14 I shared the chart below, reflecting that the broad market was breaking key short-term falling resistance lines, which was bullish. (see post here) CLICK ON CHART TO ENLARGE The charts below reflect that bull market upside leaders, Russell 2000 and...

by Chris Kimble | Sep 27, 2011 | Kimble Charting
Last week I shared the chart below, reflecting the Bull market leaders, Mid-Cap 400 (MDY) and the Russell 2000 (IWM) were on key weekly support…Support is support until broken! (see post here) Mentioned yesterday morning due to the 500 on support and the...
by Chris Kimble | Sep 23, 2011 | Kimble Charting
Mid-Cap 400 (MDY) and Russell 2000 (IWM) rallied almost 50% more than the 500 index from 3/2009 to 5/2011, reflecting bull market relative strength. Below, MDY and IWM find themselves setting on the “edge of support!” CLICK ON CHART TO ENLARGE...
by Chris Kimble | Jul 7, 2011 | Kimble Charting
CLICK ON CHART TO ENLARGE Apple broke above channel resistance on 9/3/2010 at (3) in the above chart and then rallied to the top of its channel over the next 5 months……gaining almost 30% after the breakout! The chart above was posted 2...
by Chris Kimble | Jul 1, 2011 | Kimble Charting
Suggested on 6/21 that the news out of Greece could be good for the market and “Apple” was at a place where a rally could start. (see post here) CLICK ON CHART TO ENLARGE Bull market leaders Apple and MDY have been pretty good “trade the...
by Chris Kimble | Jun 30, 2011 | Kimble Charting
Below is the quiz of earlier this week…Thanks for the massive global response. For many this was an easy quiz! CLICK ON CHART TO ENLARGE Below is the answer to the quiz… CLICK ON CHART TO ENLARGE The above chart reflects that the Mid-Cap 400...
