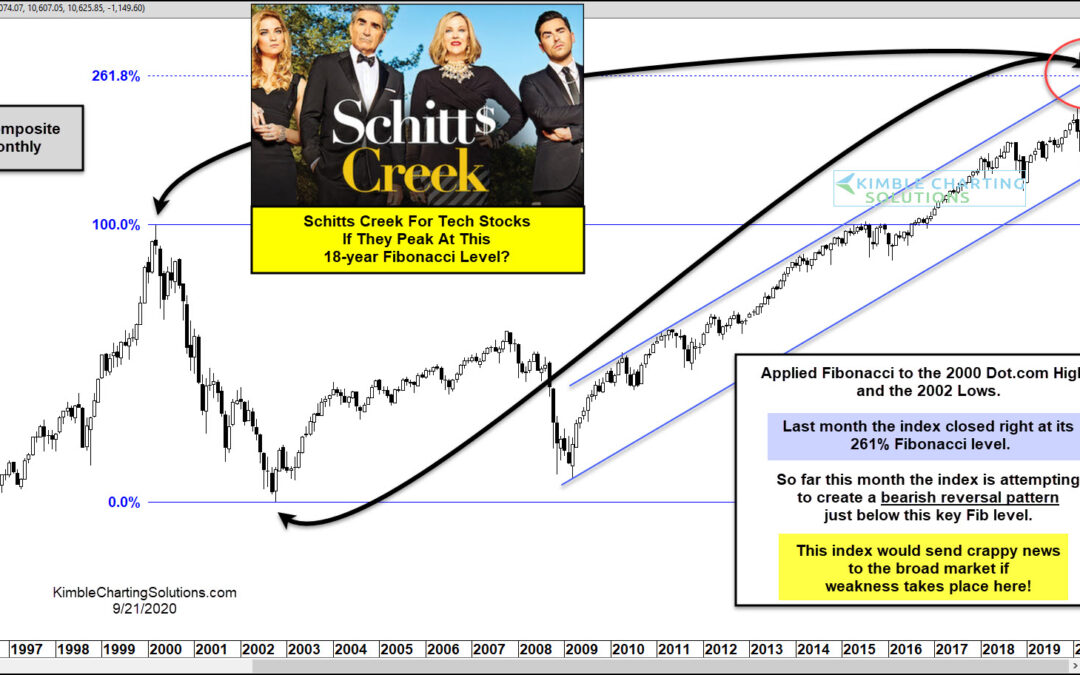
by Chris Kimble | Sep 21, 2020 | Kimble Charting
The Nasdaq has been the unparalleled leader of the stock market in 2020, having rallied furiously off the COVID-19 crash market bottom in March. But all of the excitement around tech stocks and the comeback in the stock market may be coming to an end… that is, if a...
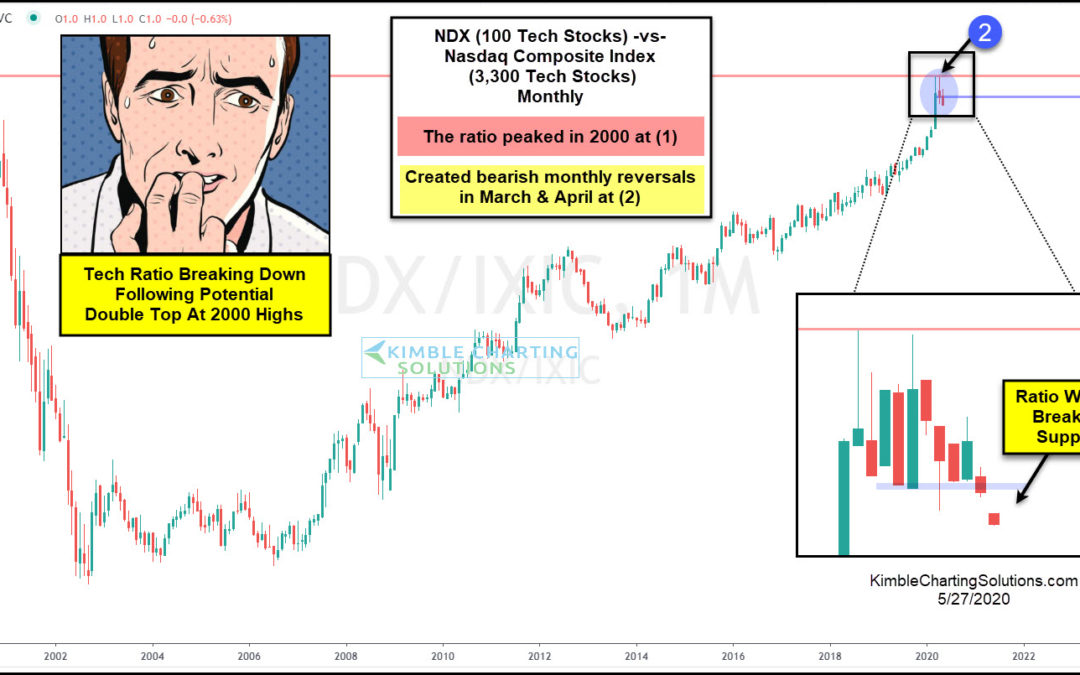
by Chris Kimble | May 28, 2020 | Kimble Charting
Tech stocks have been the clear leader of the stock market recovery rally, this year and since the lows back in 2007! But within the ranks of leadership, and an important ratio may be sending a caution message to investors. In today’s chart, we look at the ratio of...
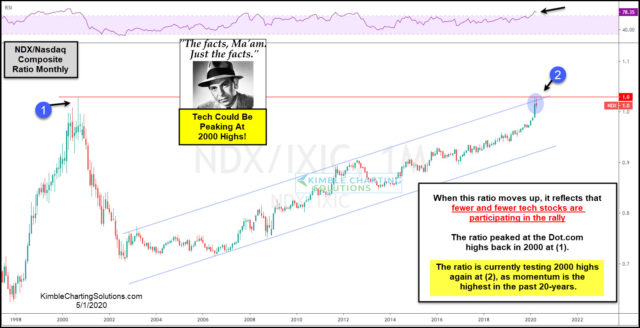
by Chris Kimble | May 1, 2020 | Kimble Charting
When fewer and fewer stocks are holding up a market, could that end up sending a bearish message to stock market bulls? Yes. This ratio looks at the NDX 100 index compared to the Nasdaq Composite Index. The ratio compares the strength of the 100 largest tech stocks...
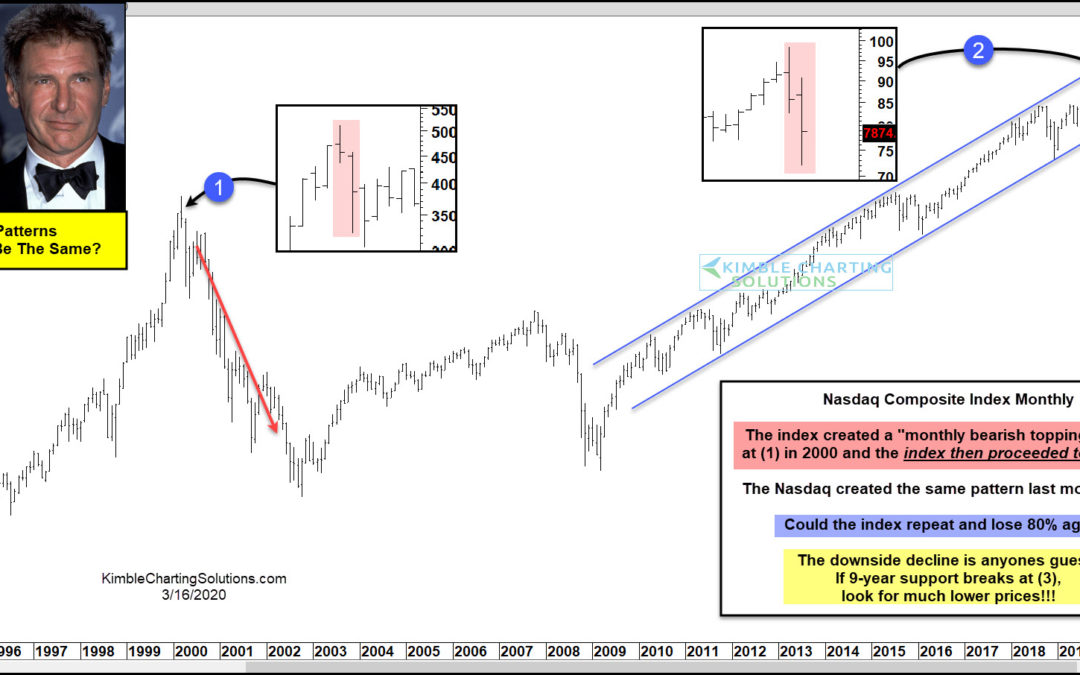
by Chris Kimble | Mar 16, 2020 | Kimble Charting
Is the Nasdaq creating a look-alike pattern similar to the 2000 highs? Last month it did. Will the results be the same? Way too soon to tell! This chart looks at the Nasdaq Composite Index over the past 25-years on a monthly basis. The index created a monthly bearish...
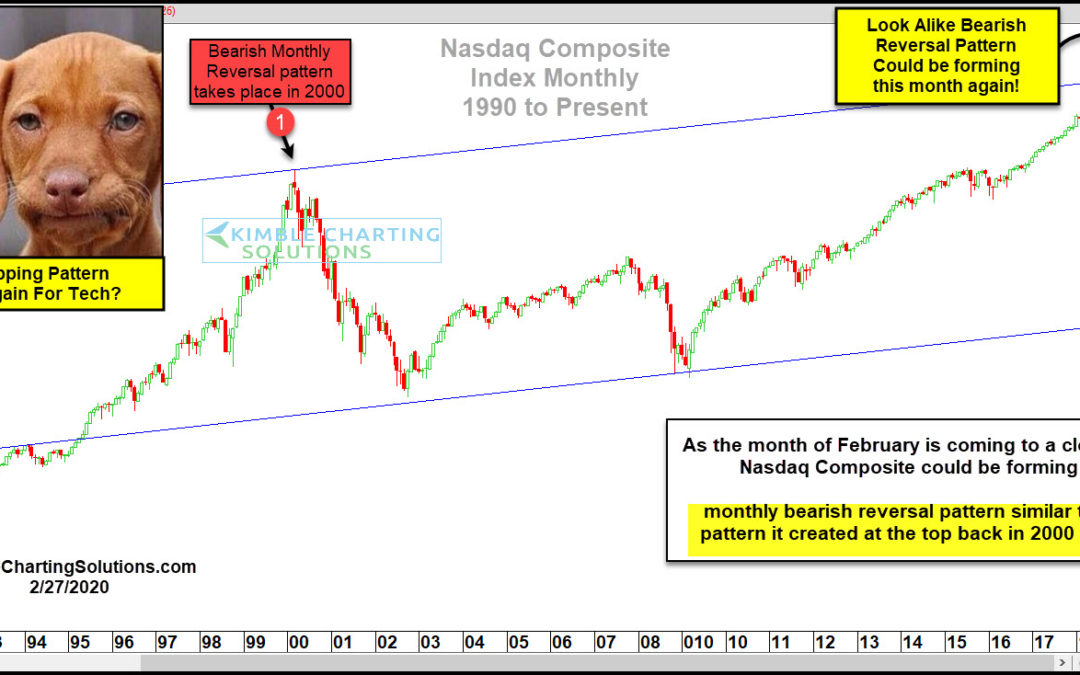
by Chris Kimble | Feb 27, 2020 | Kimble Charting
I am a fan of weekly charts over daily charts and monthly charts over weekly charts. As the month of February is nearing an end, the Nasdaq Composite could be creating a pattern that deserves a ton of attention! This chart looks at the Nasdaq Composite Index over the...
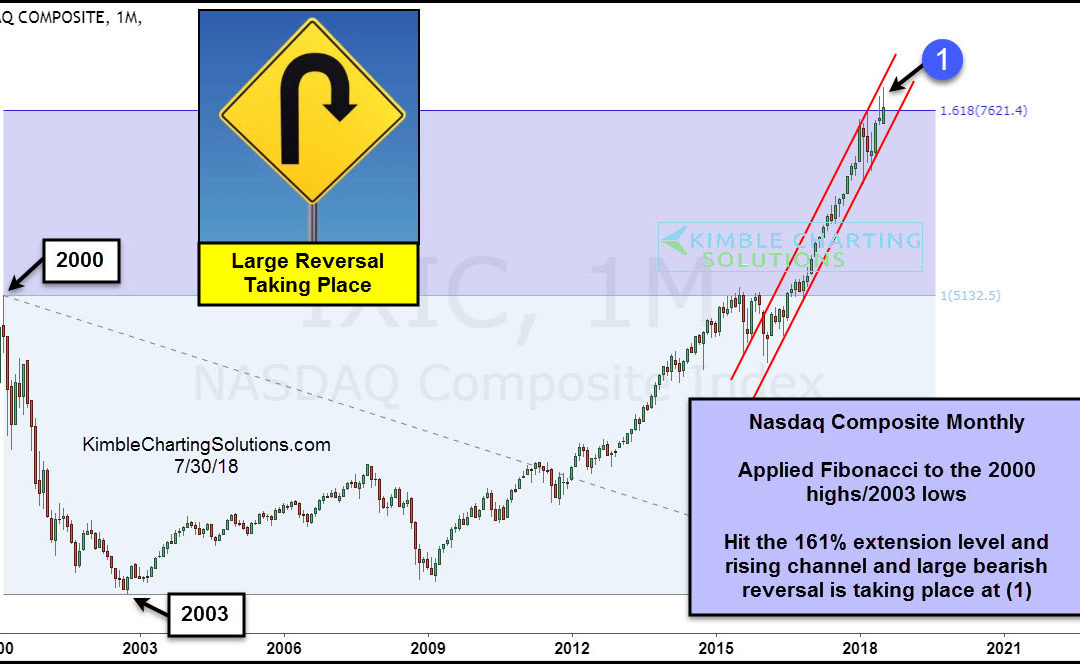
by Chris Kimble | Jul 30, 2018 | Kimble Charting
CLICK ON CHART TO ENLARGE This chart looks at the Nasdaq Composite Index on a monthly basis over the past 20-years, where we applied Fibonacci to the 2000 highs and the 2003 lows. This past month the index was testing the 161% Fibonacci extension level off the...
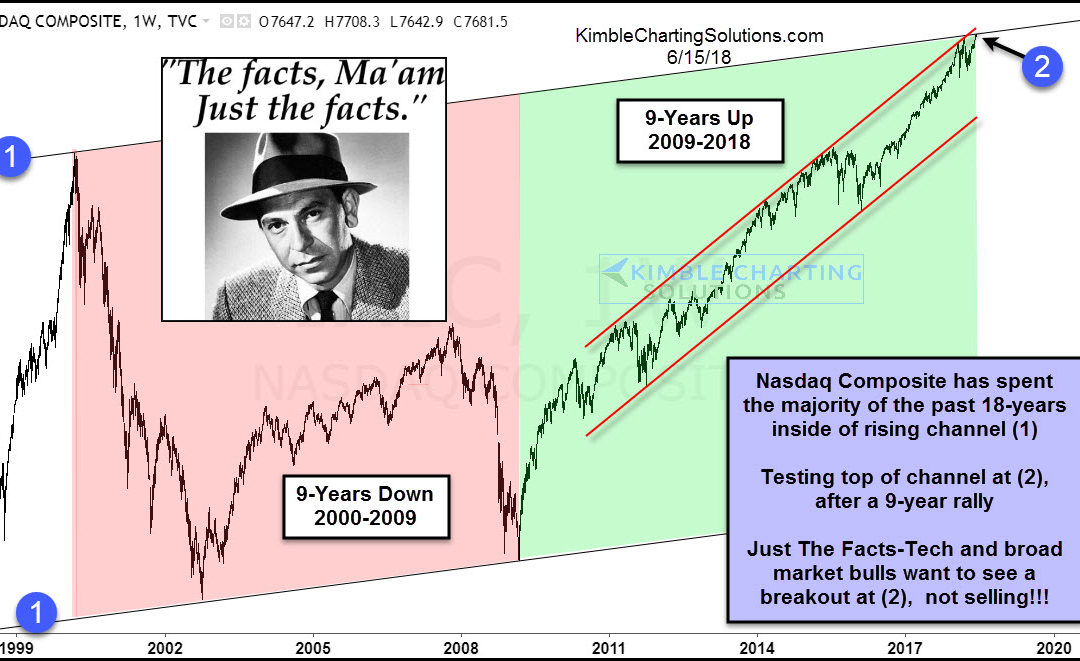
by Chris Kimble | Jun 15, 2018 | Kimble Charting
CLICK ON CHART TO ENLARGE This chart looks at the Nasdaq Composite index over the past 20-years, reflecting that the long-term trend is up and it has hit all-time highs of late. The index has spent the majority of the past 18-years inside of rising channel (1). It...

by Chris Kimble | Oct 29, 2015 | Global Dashboard, Kimble Charting
CLICK ON CHART TO ENLARGE Yesterday we conducted a webinar for our membership, in which we shared several positive stock seasonal studies. These studies reflected seasonal stock market strength takes place between now and the end of April next year. Historically it...
