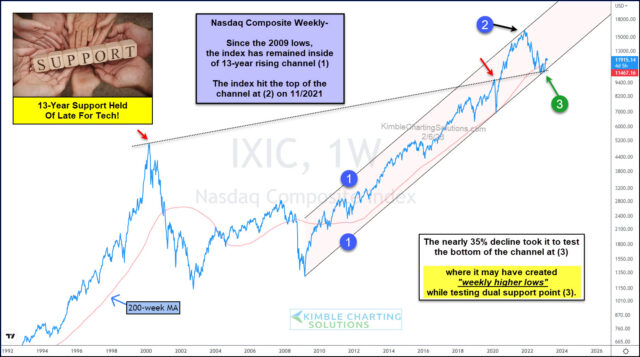
by Chris Kimble | Feb 7, 2023 | Kimble Charting
New year, new start. Tech stocks are finally showing signs of life and stock market bulls couldn’t be happier. And it couldn’t come at a better time! Today “weekly” chart of the Nasdaq Composite highlights this reversal of fortune and imparts some wisdom about trend...
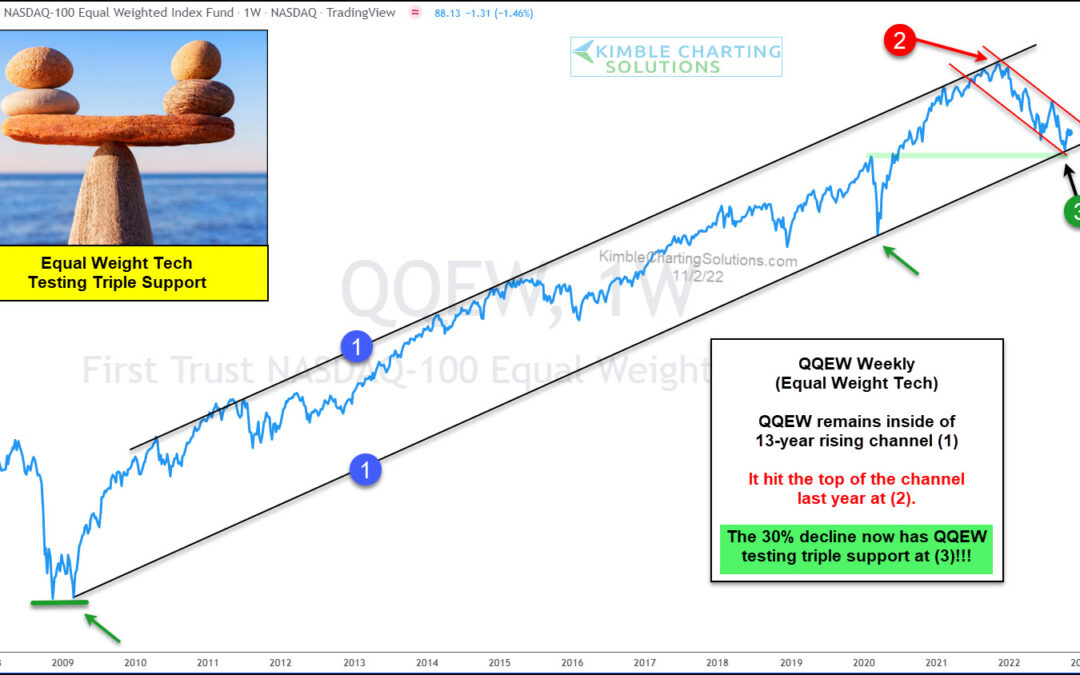
by Chris Kimble | Nov 2, 2022 | Kimble Charting
The technology sector is a vibrant and important cog in today’s economy and stock market. Tech represents both growth and leadership in global equities and has been under pressure due to rising interest rates. Today’s chart highlights this bearish development quite...
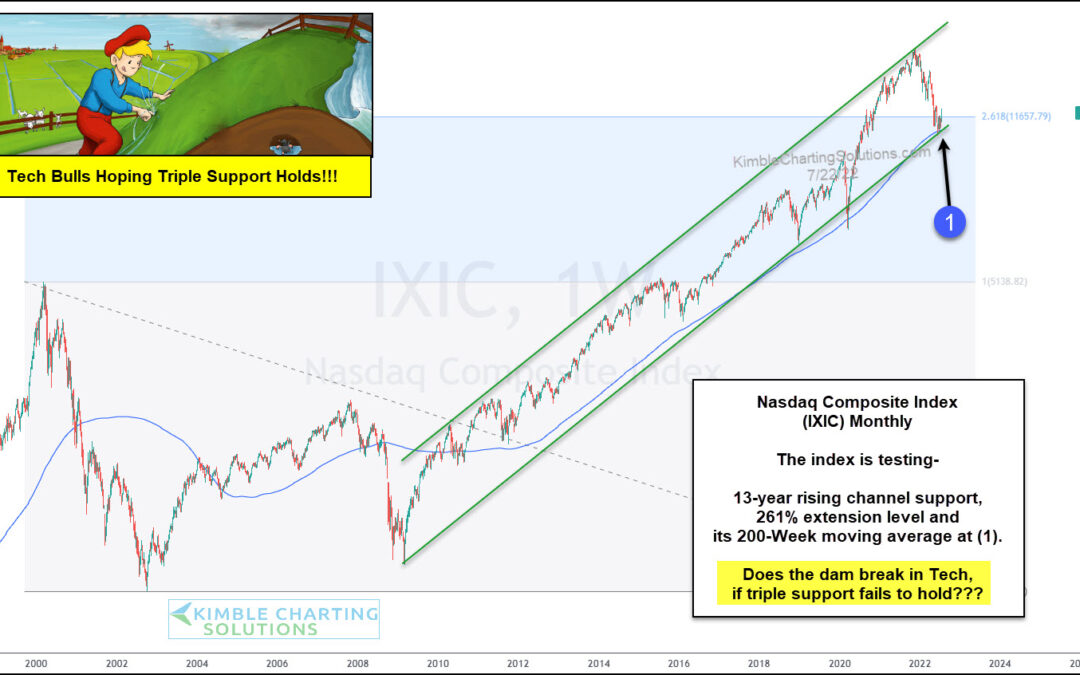
by Chris Kimble | Jul 26, 2022 | Kimble Charting
The major stock market indices have spent much of the first half of 2022 engulfed in a bear market that has eaten away any investor gains experienced last year. Stock market bulls are anxious that a trading low is forming but recent volatility has clouded short-term...
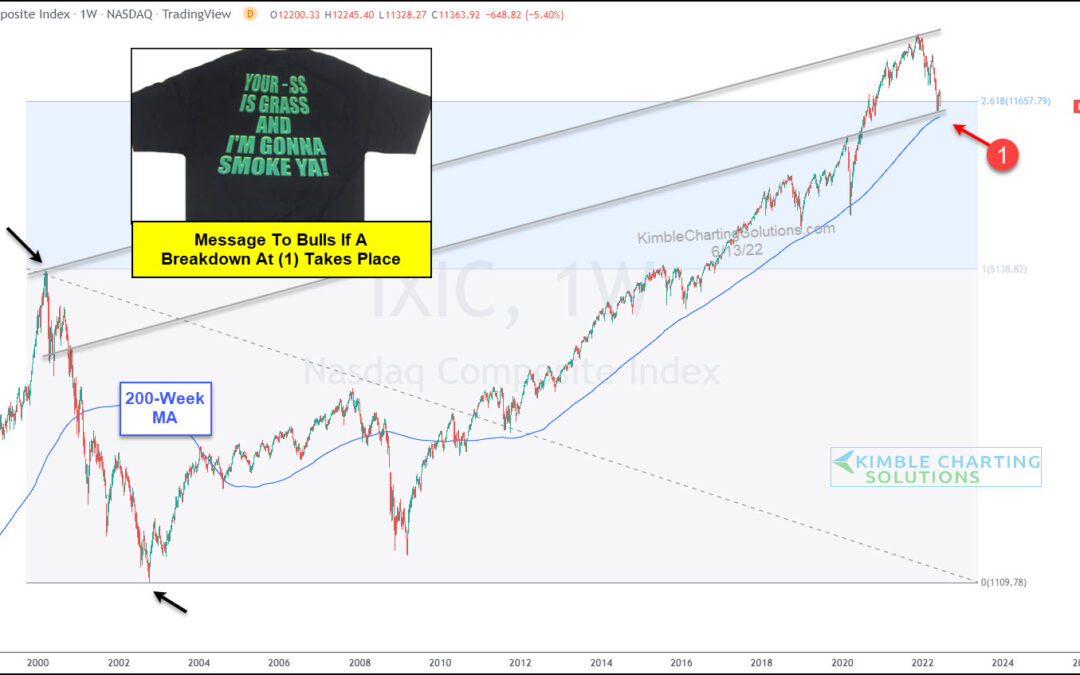
by Chris Kimble | Jun 14, 2022 | Kimble Charting
Technology stocks have been the market leader for the past 13 years. But what leads on the way up, often leads on the way down. And with inflation and rising interest rates, it’s the growth-oriented technology sector that is getting hit the hardest. Today we look at a...
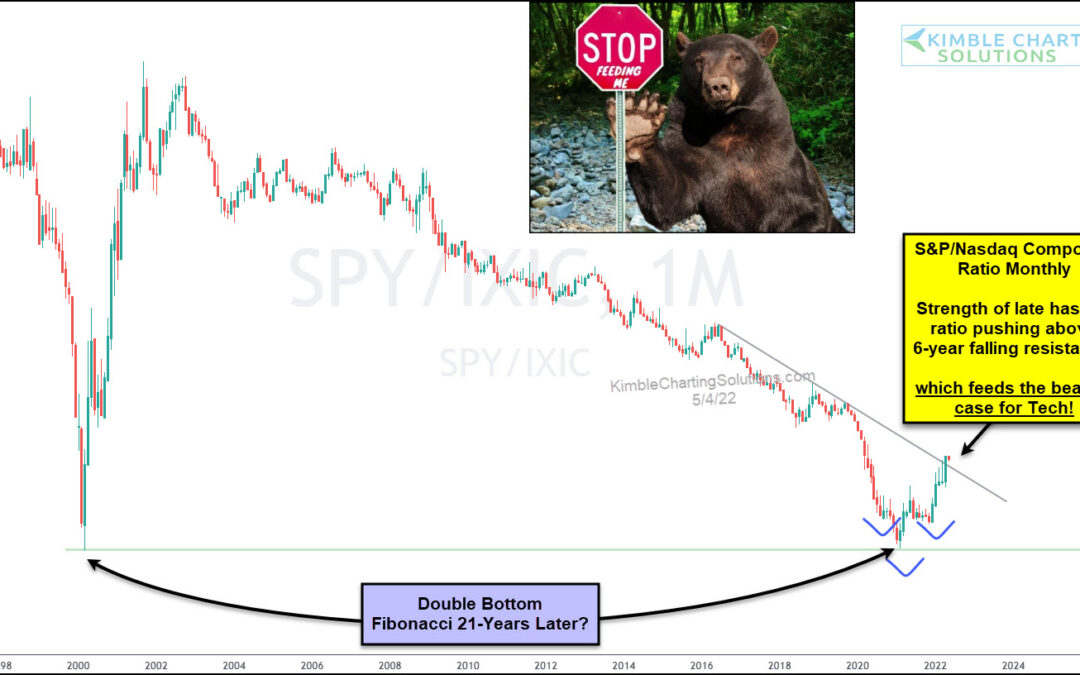
by Chris Kimble | May 5, 2022 | Kimble Charting
The stock market has seen some ugly action here in 2022. But one thing has become clear: growth stocks have been battered worse than value stocks. Within this spectrum, we can also see that technology stocks (also associated with “growth”) have performed worse than...
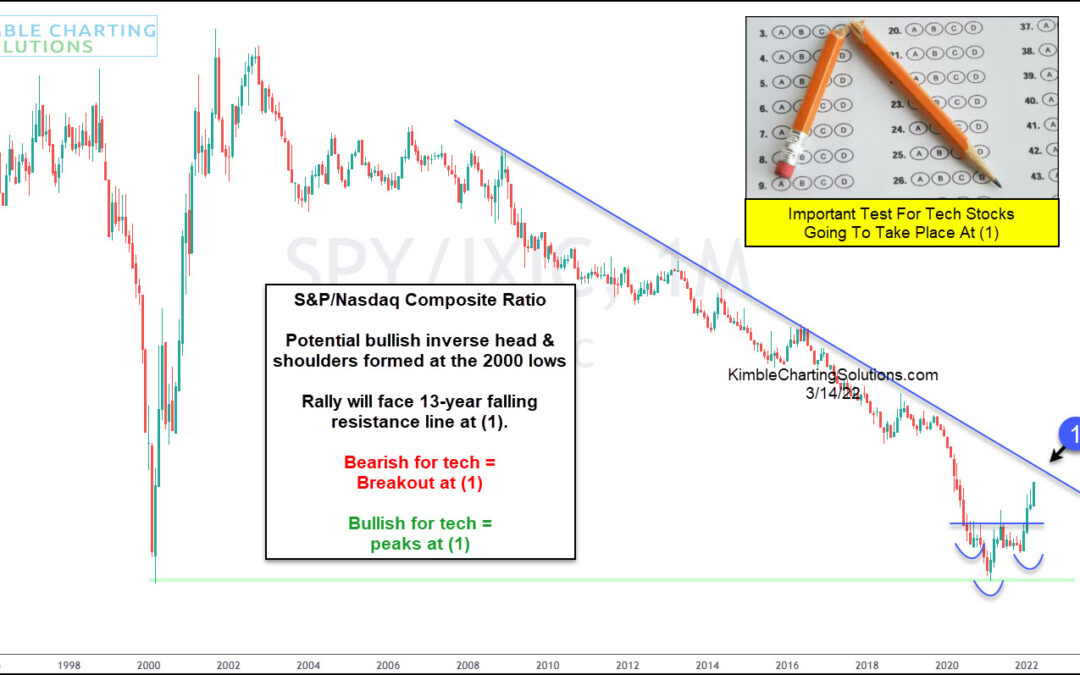
by Chris Kimble | Mar 15, 2022 | Kimble Charting
Over the past several months, growth stocks have begun to fall behind value stocks. And this theme can easily be seen in the growth-oriented Nasdaq Composite. Technology stocks have been a market leader for much of the past two decades. But this trend/theme appears to...
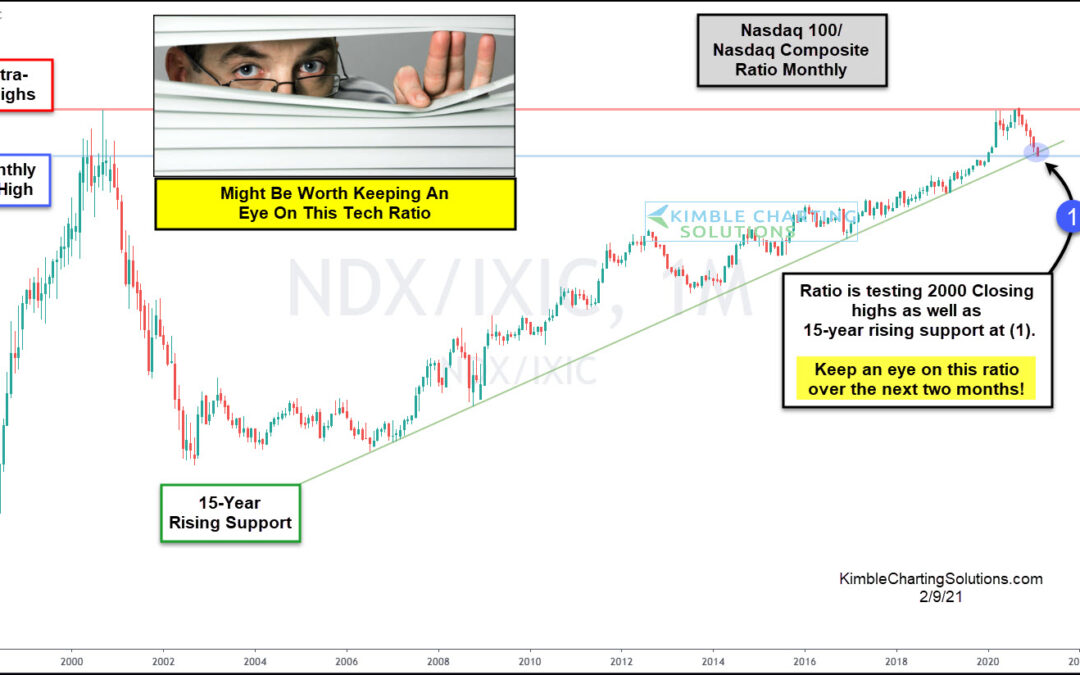
by Chris Kimble | Feb 10, 2021 | Kimble Charting
Tech stocks continue to lead the market higher, with the Nasdaq Composite and Nasdaq 100 recording intra-day all-time highs. BUT something isn’t right beneath the surface. And it could be a rally killer. I emphasize “could”. The 12-year bull market has been lead by...
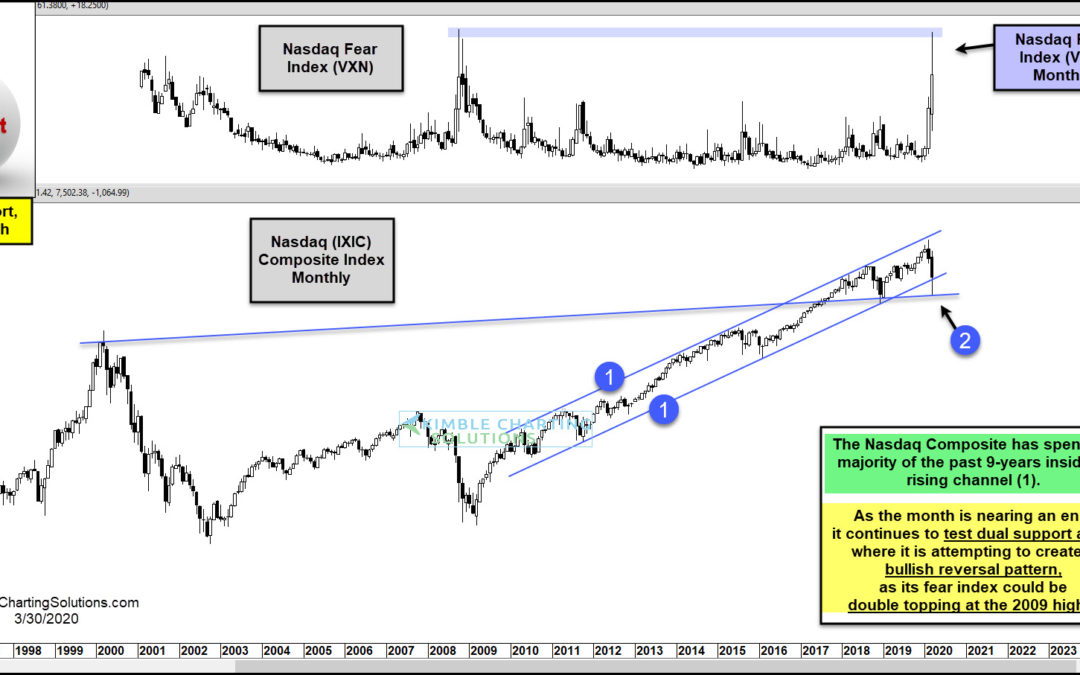
by Chris Kimble | Mar 30, 2020 | Kimble Charting
Is an important Tech Index sending a bullish message to investors? It is making an attempt! Does that mean a low in this important sector is in play? Humbly it is too soon to say at this time! This chart looks at the Nasdaq Composite Index over the past 25-years on a...
