by Chris Kimble | Nov 19, 2018 | Kimble Charting
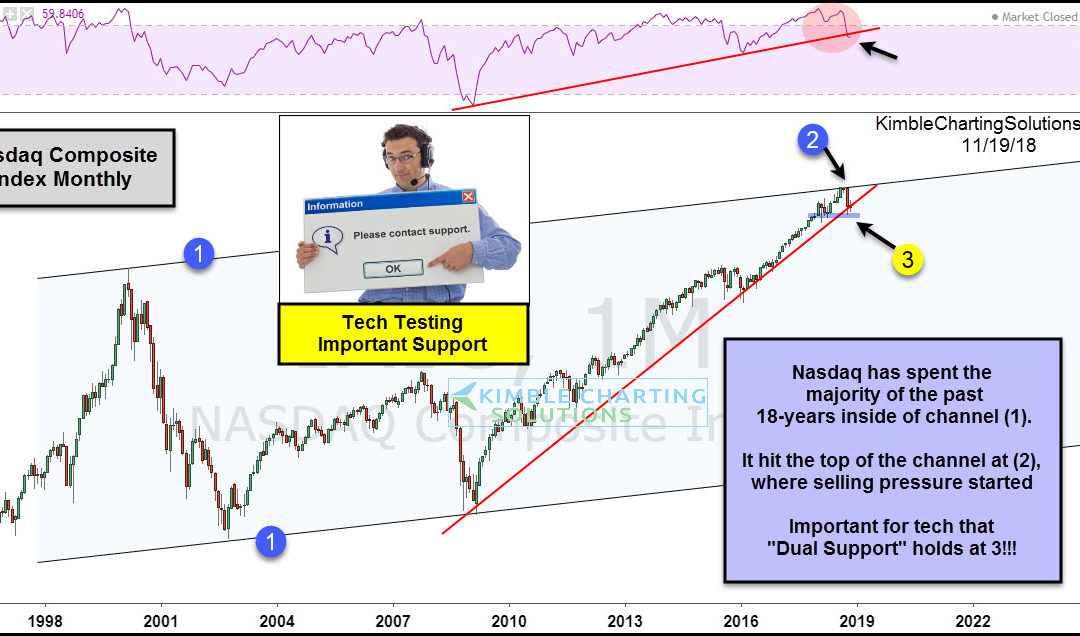
CLICK ON CHART TO ENLARGE This chart looks at the Nasdaq Composite Index over the past 22-years on a monthly basis. The chart highlights that the index has spent the majority of the past 18-years inside of rising channel (1). The rally off the 2009 lows hit the top of...
by Chris Kimble | Jul 31, 2018 | Kimble Charting
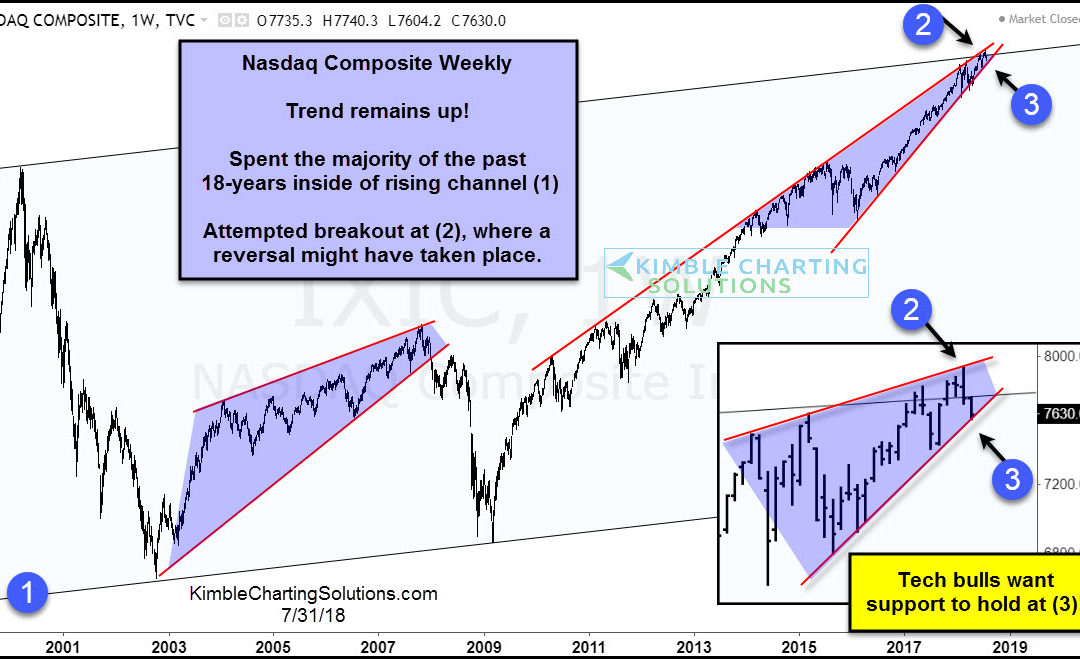
CLICK ON CHART TO ENLARGE This chart looks at the Nasdaq Composite Index over the past 20-years. The index has spent the majority of the past 18-years inside of rising channel (1). The trend is clearly up as the index is very near all-time highs and nothing of late...
by Chris Kimble | Apr 20, 2018 | Kimble Charting
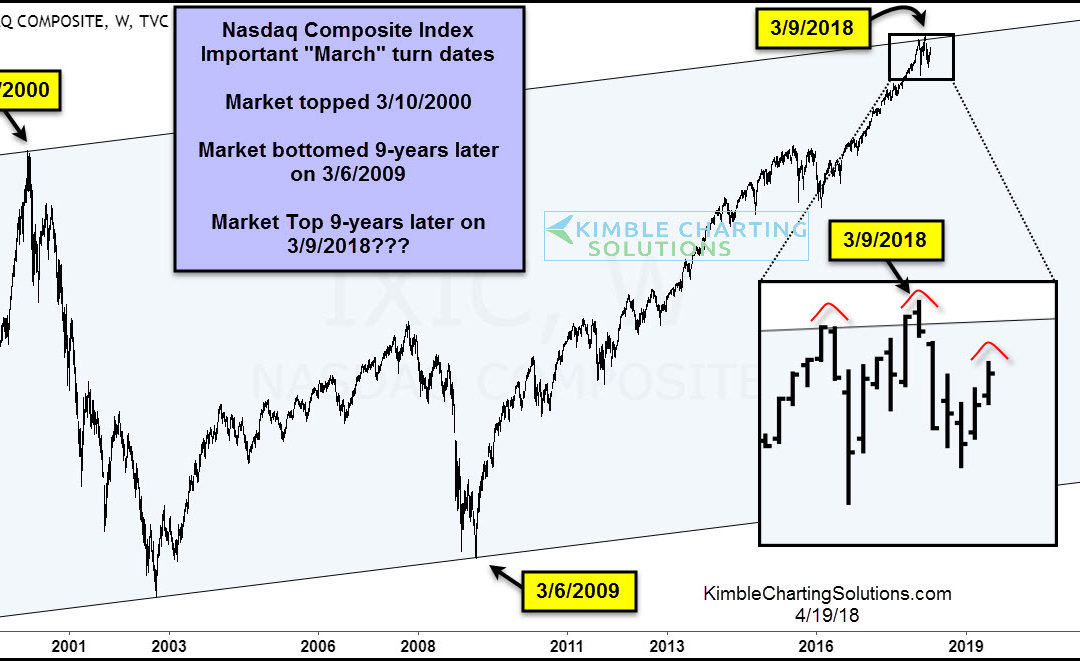
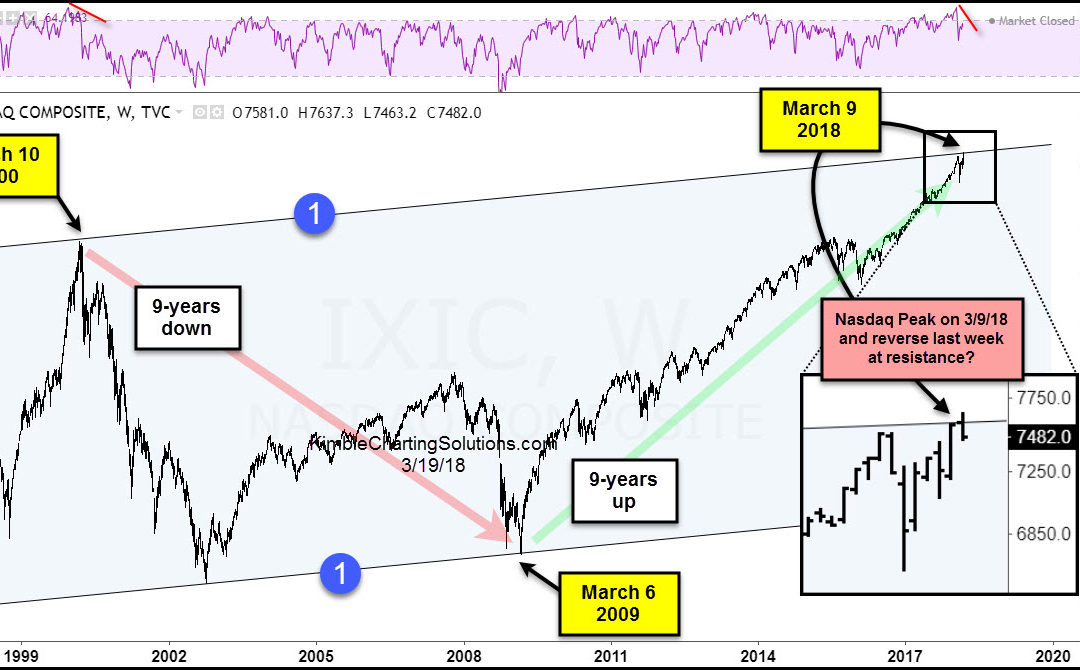
The month of March has produced some major turning points for the Nasdaq Composite over the last 20 years. The Nasdaq topped in March of 2000 and bottomed 9 years later in March 2009. Is it possible that 9 years after the major bottom, we put in a major top (March...
by Chris Kimble | Mar 20, 2018 | Kimble Charting
The latest leg higher in the bull market (off the 2016 lows) has been lead by the Technology sector and Nasdaq Composite. FANG stocks (Facebook, Amazon, Netflix, Google) have given the Nasdaq an extra burst of momentum, helping to create a self-fulfilling ride higher…...

by Chris Kimble | Dec 1, 2017 | Kimble Charting
First Fact….The Nasdaq tech train trend is up and has NOT derailed at this time, nor has it slowed down! Below looks at the Nasdaq Composite index over the past 20-years- CLICK ON CHART TO ENLARGE As mentioned above, the trend in the Tech remains higher and it...

by Chris Kimble | Sep 28, 2017 | Kimble Charting
The Nasdaq 100 and Nasdaq Composite index both remain in solid rising trends (Bull Markets), Nothing of late has changed the long-term trend! Below looks at the Nasdaq ETF QQQ over the past few years and highlights some short-term price action that could become...

by Chris Kimble | Mar 3, 2017 | Kimble Charting
Below looks at the the Nasdaq Composite Index and the Russell 2000 over the past couple of decades. No doubt both of these remain in strong up trends, both creating a series of higher highs and higher lows. CLICK ON CHART TO ENLARGE The strong rallies over the past...
