by Chris Kimble | Nov 5, 2019 | Kimble Charting
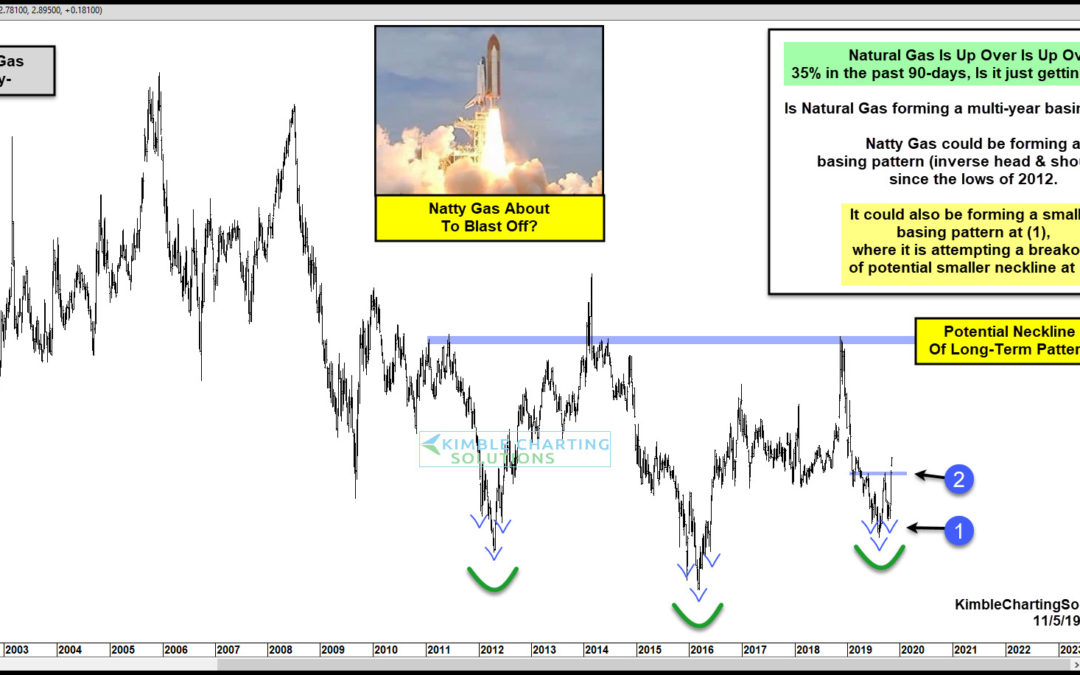
The S&P 500 has done well the past 90-days, as it has rallied by +7.2%. When it comes to top-performing assets, Natural Gas has done tons better, as it has rallied over 38% in the same time frame. As Natty has screamed higher, is blast off about to take place or...

by Chris Kimble | Nov 4, 2014 | Kimble Charting
CLICK ON CHART TO ENLARGE Premium members established a pair trade on the first of August, going long Natural Gas (UNG) and Short Crude Oil (DTO). Why establish this trade? At the time of the trade, Crude Oil was up against resistance of a multi-year pennant...
by Chris Kimble | Apr 14, 2014 | Kimble Charting
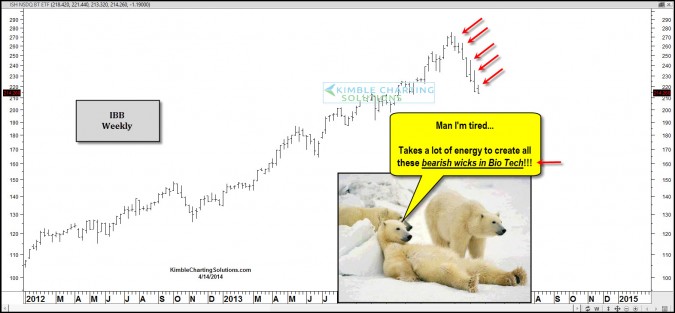
CLICK ON CHART TO ENLARGE Bio Tech led on the way up and so far is been a leader on the way down! Another bearish wick this past week took place in IBB. Keep you eye on this leader and watch for its impact to the NDX 100 !!! –...

by Chris Kimble | Feb 26, 2014 | Kimble Charting
CLICK ON CHART TO ENLARGE So far 2014 has been the “year of the dog!” What do I mean by this? Year to date, the best performing assets were the “Dogs of the past 3-years!” I highlighted these assets to Premium and sector members the...

by Chris Kimble | Feb 19, 2014 | Kimble Charting
CLICK ON CHART TO ENLARGE Last summer I started sharing with Premium and Sector/Commodity Sentiment Extreme members that a “Multi-year bullish inverse head & shoulders” pattern looked to be in the making. I have been involved with the Power of...

by Chris Kimble | Feb 13, 2014 | Kimble Charting
CLICK ON CHART TO ENLARGE When Dogs, Few Bulls and pattern support comes together… it often spells “OPPORTUNITY!” Sir John Templeton would often say…”Buy at the point of maximum pessimism!” I started out the year highlighting...
by Chris Kimble | Jan 7, 2014 | Kimble Charting
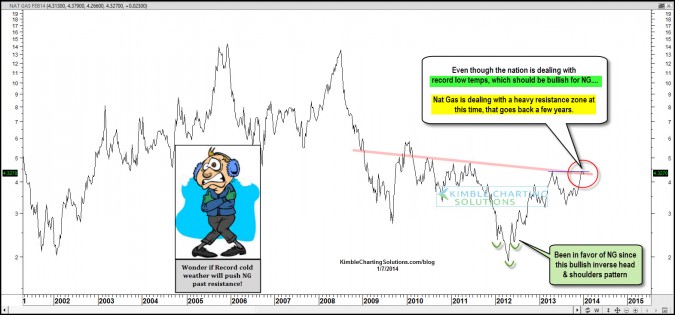
CLICK ON CHART TO ENLARGE The Power of the Pattern reflected to members that a very bullish opportunity was at hand in Natural Gas as it was creating a bullish inverse head & shoulders pattern back in 2000, when few investors like it (only 17% bulls) see...

by Chris Kimble | Dec 12, 2013 | Kimble Charting
CLICK ON CHART TO ENLARGE In the summer of 2012, the Power of the Pattern shared that a bullish inverse head & shoulders pattern in Natural gas was forming at a potential long-term double bottom with few investors bullish the product and just a few months later NG...
