
by Chris Kimble | Sep 1, 2015 | Global Dashboard, Kimble Charting
CLICK ON CHART TO ENLARGE Could a price zone that started impacting the Nikkei 30-years ago still impact it again today? Well it looks like it is! The Nikkei found the 21,000 level, line (1), to be support several times between 1987 and 1992. Once this support broke...
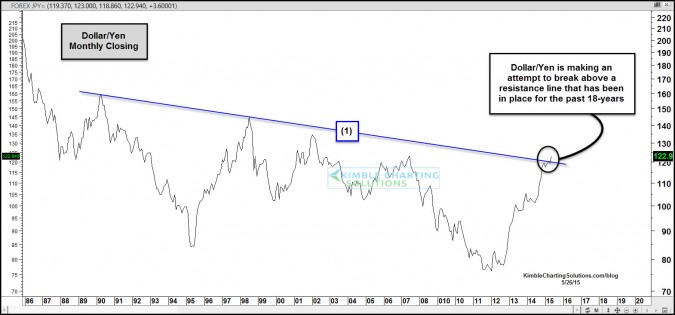
by Chris Kimble | May 26, 2015 | Kimble Charting
CLICK ON CHART TO ENLARGE The chart above takes a look at the U.S. Dollar/Yen ratio over the past few decades. Monthly resistance line (1) has been in play for the past 18-years. As the month of May is nearly over with, the US$/Yen is making an attempt to break above...

by Chris Kimble | Mar 23, 2015 | Global Dashboard, Kimble Charting
CLICK ON CHART TO ENLARGE The S&P 500 is near all-time highs. The Nikkei 225 can not say the same thing, as its remains nearly 50% below its monthly closing high back in 1989. This year, the Nikkei is doing much better than the S&P 500, up 10% more and it is...

by Chris Kimble | Feb 24, 2015 | Global Dashboard, Kimble Charting
CLICK ON CHART TO ENLARGE The above 3-pack looks at the Value Line Geometric, Nasdaq 100 and Nikkei 225 since 1990, on a “Monthly Closing” basis. As you can see the Value Line is attempting to make a triple top breakout, the Nikkei is attempting to break...

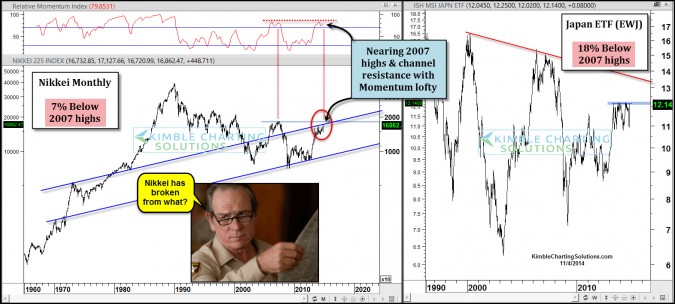
by Chris Kimble | Dec 5, 2014 | Kimble Charting
CLICK ON CHART TO ENLARGE 2007 was a unique year in Japan as their stock market peaked and Yen was about to embark on a strong rally…for a while. The above chart reflects that the Nikkei and Yen have had a wild ride the past 7 years. The Nikkei peaked in 2007,...

by Chris Kimble | Nov 17, 2014 | Kimble Charting
CLICK ON CHART TO ENLARGE The worlds third largest economy announced overnight that it was slipping into recession, shares CNBC this morning. (see article here) This news appears to have surprised a few people and raises some questions if policies of...
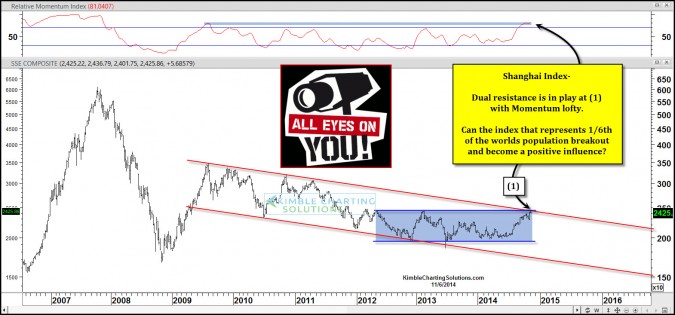
by Chris Kimble | Nov 6, 2014 | Kimble Charting
CLICK ON CHART TO ENLARGE Is what happens in China important to the rest of the world? I would guess a few would say yes. When it comes to stock market performance, is what happens in China important to the S&P 500 or other global stock markets? I...
by Chris Kimble | Nov 4, 2014 | Kimble Charting
CLICK ON CHART TO ENLARGE When it comes to breakouts, let me make one thing clear, I like to buy them! How does one define a breakout? When it comes to technical analysis, breakouts are viewed from many different angles. One simple view of a breakout is...
