
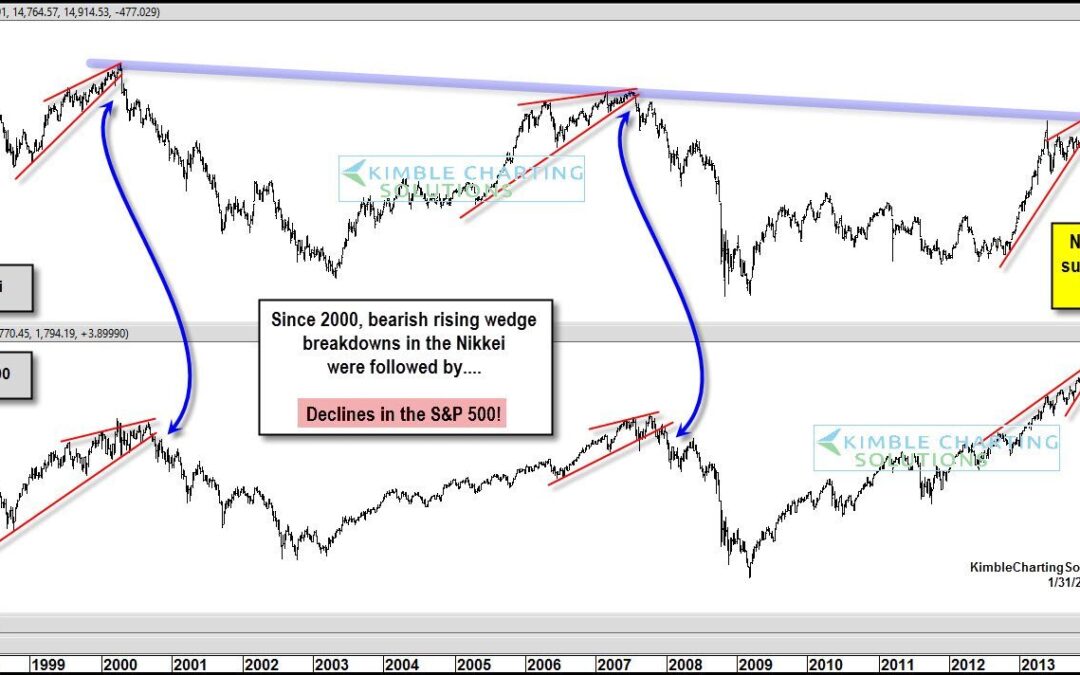
by Chris Kimble | Feb 4, 2014 | Kimble Charting
CLICK ON CHART TO ENLARGE I have a 401k and don’t own Japanese stocks nor the Nikkei, why in the heck should I care if Japan has a problem or not? I believe it can pay to be aware of what the hottest performing stock market in the world is doing....
by Chris Kimble | Jan 31, 2014 | Kimble Charting
CLICK ON CHART TO ENLARGE Looking back one year, the S&P 500 did well, up 19%. Nikkei did a little bit better, up 41%. When it comes to relative performance, the Nikkei is the clear winner, up 100% more than the S&P 500 (see performance below) CLICK ON...
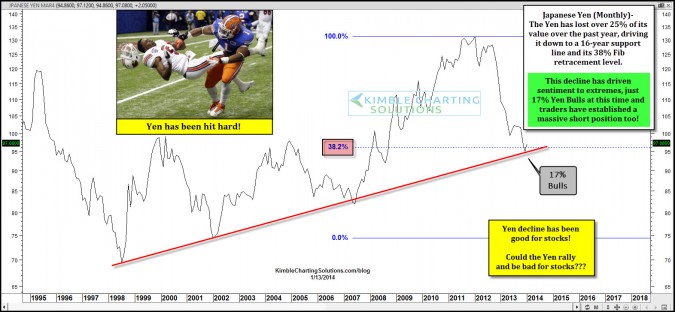
by Chris Kimble | Jan 13, 2014 | Kimble Charting
CLICK ON CHART TO ENLARGE The Yen could well be the worlds least loved currency, due to its 25% decline over the past year, as bullish sentiment stands at just 17%. The decline in the Yen has been greeted by a large rally in the Nikkei (strongest rally in the...

by Chris Kimble | Dec 31, 2013 | Kimble Charting
CLICK ON CHART TO ENLARGE Its been a long time since the Nikkei 225 index broke above this resistance line, make that a couple of decades (20 Years)! Time and time again the Nikkei has created lower highs, failing to get above this falling resistance line until...

by Chris Kimble | Dec 4, 2013 | Kimble Charting
CLICK ON CHART TO ENLARGE The Nikkei Index and the China ETF (FXI) have something in common…”they’ve been here before!” Been where? Both have hit falling resistance line (1) several times over the past few years, Nikkei since 1996! Its...

by Chris Kimble | Nov 22, 2013 | Kimble Charting
CLICK ON CHART TO ENLARGE Since 1990 the red line has been resistance for the Nikkei Index. The inset chart reflects that the Nikkei has underperformed the S&P 500 by more than 450% since this resistance line came into play! Will this line keep the Nikkei trapped...

by Chris Kimble | Nov 11, 2013 | Kimble Charting
CLICK ON CHART TO ENLARGE I would first like to take a moment and express my appreciation to all Veterans! Thank you for your service and sacrifice. The photo above caught my eye when one thinks of Courage and heading into uncharted waters. For sure the markets...
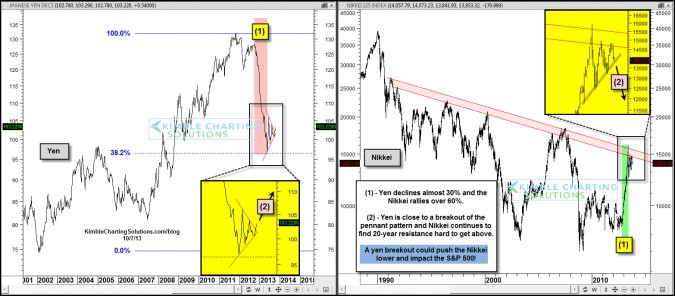
by Chris Kimble | Oct 7, 2013 | Kimble Charting
CLICK ON CHART TO ENLARGE The chart directly below reflects a 6 month rally from 11/20/12 to 5/20/12 of the Nikkei and S&P 500, in which the Nikkei gained over 48% more than SPY. I am of the belief that its important to watch the action of the hottest stock...
