
by Chris Kimble | May 27, 2014 | Kimble Charting
CLICK ON CHART TO ENLARGE What do the highs in 2000 & 2007 and the lows in 2002 and 2009 have in common? Each of these took place 7-years apart in the broad based NYSE Index. Odds are most likely slim that a key high takes place 7-years after the 2007 highs...

by Chris Kimble | May 7, 2014 | Kimble Charting
CLICK ON CHART TO ENLARGE Only twice in 35-years has the NYSE Index been at all-time highs, when the Russell 2000 broke below its 200MA line. Those two times were in 1999 & 2007. The above chart reflects where the S&P 500 was, when this took...

by Chris Kimble | Apr 7, 2014 | Kimble Charting
CLICK ON CHART TO ENLARGE This 5-pack of chart focuses on key U.S. stock index’s and how each of them are facing key long-term lines at the exact same time and a couple of them are facing Fibonacci extension levels too. If one breaks out will all...
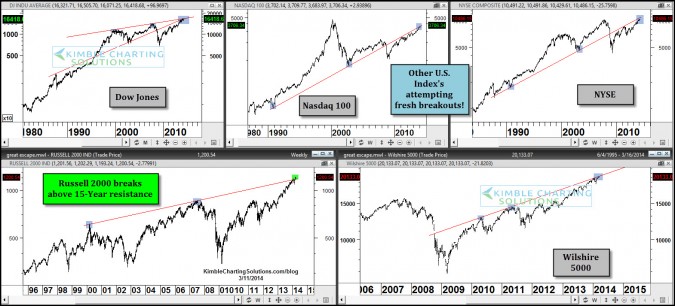
by Chris Kimble | Mar 11, 2014 | Kimble Charting
CLICK ON CHART TO ENLARGE Several popular U.S. stock index’s are at or near all time highs. Of late the Russell 2000 just broke above a 15-year resistance line. Now we will soon see if the Dow, NDX, NYSE and Wilshire 5000 follow suit. CLICK ON CHART...

by Chris Kimble | Feb 10, 2014 | Kimble Charting
CLICK ON CHART TO ENLARGE A week ago today, the Dow fell 300 points, broke a couple of support lines+ and moving averages. News stories appeared about a 1929 repeat and were discussed a good bit and VIX fear levels jumped up a large percentage. Due...

by Chris Kimble | Jan 26, 2014 | Kimble Charting
CLICK ON CHART TO ENLARGE Four key index’s, Dow, Russell, Wilshire 5000 and the NYSE composite index all created reversal patterns, at 15-year plus resistance this week, with average valuations at 1929 & 2007 levels. Reversals at resistance...

by Chris Kimble | Dec 31, 2013 | Kimble Charting
CLICK ON CHART TO ENLARGE Is the NYSE Index creating a “Double Top” six years later? As we are ending another year, its easy to look back on the broad based index and see that its at the same price as it was 6-years ago, prior to a rather large decline. Is...

by Chris Kimble | Dec 5, 2013 | Kimble Charting
CLICK ON CHART TO ENLARGE NYSE Index created a “Double Bottom” leading to great times to buy into the markets at these lows. Is the NYSE index creating a “Double Top” almost the same distant apart as the Double Bottom? A breakout would...
