
by Chris Kimble | Sep 16, 2013 | Kimble Charting
CLICK ON CHART TO ENLARGE When interest rates starting moving higher in May, the Real Estate market became very concerned and sellers stepped in. The Dow Jone Home construction index and REIT ETF (IYR) both fell over 15% in less than a four month time period. The...

by Chris Kimble | Aug 20, 2013 | Kimble Charting
CLICK ON CHART TO ENLARGE Real Estate ETF (IYR) has lost 15% of its value in less than 90 days. Two support lines are in play right now. The Power of the Pattern suggested in May that a large bearish rising wedge was in place in the Real Estate market was due to fall...
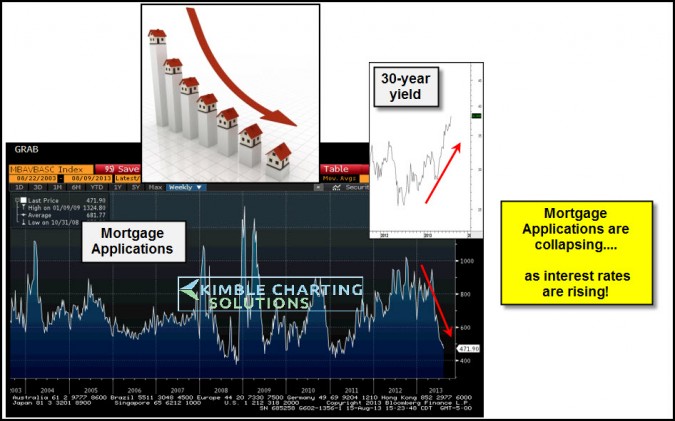
by Chris Kimble | Aug 16, 2013 | Kimble Charting
CLICK ON CHART TO ENLARGE New mortgage applications are falling like a rock of late!. Is this due to the steep rise in rates? Seen the inset rate chart above and look what has happened to applications during the window of rising rates. Home builders are already into...

by Chris Kimble | Aug 15, 2013 | Kimble Charting
CLICK ON CHART TO ENLARGE Home builders created a bearish wedge in 2006, broke support, rallied to “kiss the underside” of resistance then proceed to fall over 80% in value and the broad market followed. Over the past couple of years, Home builders formed...

by Chris Kimble | Aug 13, 2013 | Kimble Charting
CLICK ON CHART TO ENLARGE Home builders and Real Estate (IYR) gave an early signal to some up coming economic and broad stock market weakness back in 2006 & 2007. Of late Home builders and IYR are sinking in price, breaking lower below support of large bearish...

by Chris Kimble | Aug 9, 2013 | Kimble Charting
CLICK ON CHART TO ENLARGE The chart below reflects its been a tough year for Government Bond ETF TLT, as its down 11%, while the S&P 500 is up 19%, almost a 30% spread. If an investors portfolio was invested 60% in the S&P 500 and 40% in Government Bonds, at...

by Chris Kimble | Jul 31, 2013 | Kimble Charting
CLICK ON CHART TO ENLARGE Real Estate has been on a roll over the past few years, moving strongly higher off the 2009 lows. Two months ago today the Power of the Pattern shared that the last time the Home builder’s created this pattern the S&P 500 fell 50%...

by Chris Kimble | Jul 24, 2013 | Kimble Charting
The Power of the Pattern shared that interest rates were ready to blast off and government bonds could get hurt on 5/3 (See post here) Since then rates are up 40% and TBF the bond short has made as much as SPY has for the Year (see TBF performance here) Could...
