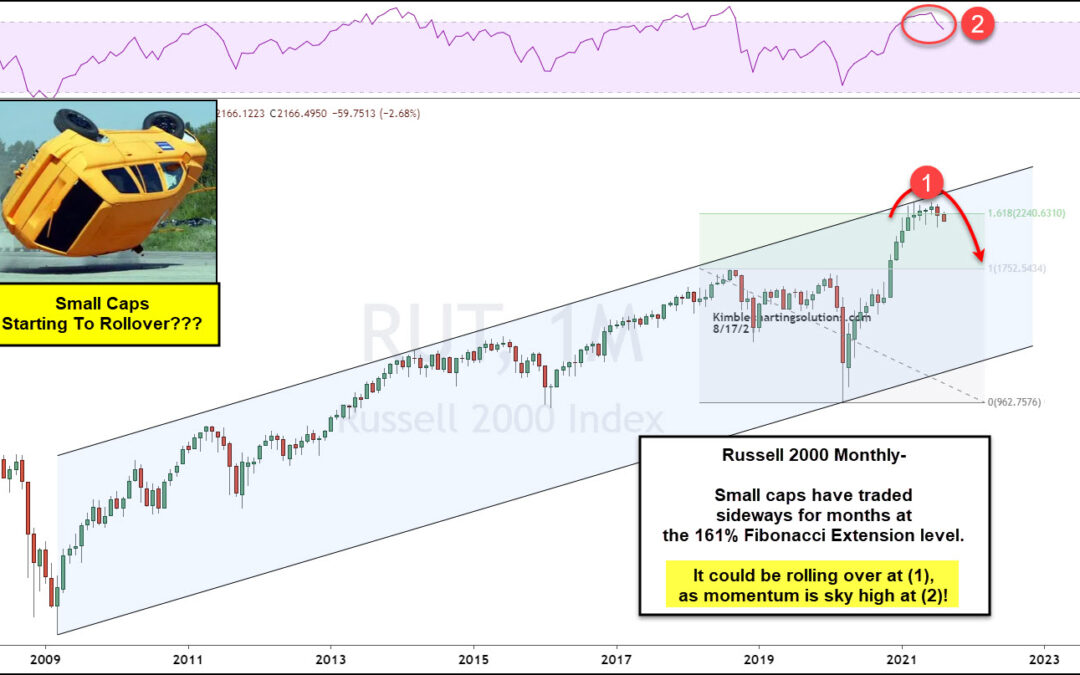
by Chris Kimble | Aug 18, 2021 | Kimble Charting
Small cap stocks spent several months charging higher out of the 2020 coronavirus crash lows. BUT they have also spent the past several months forming a reversal pattern that is beginning to look like a “U-Turn”. Today’s chart looks at the Russell 2000 small cap index...
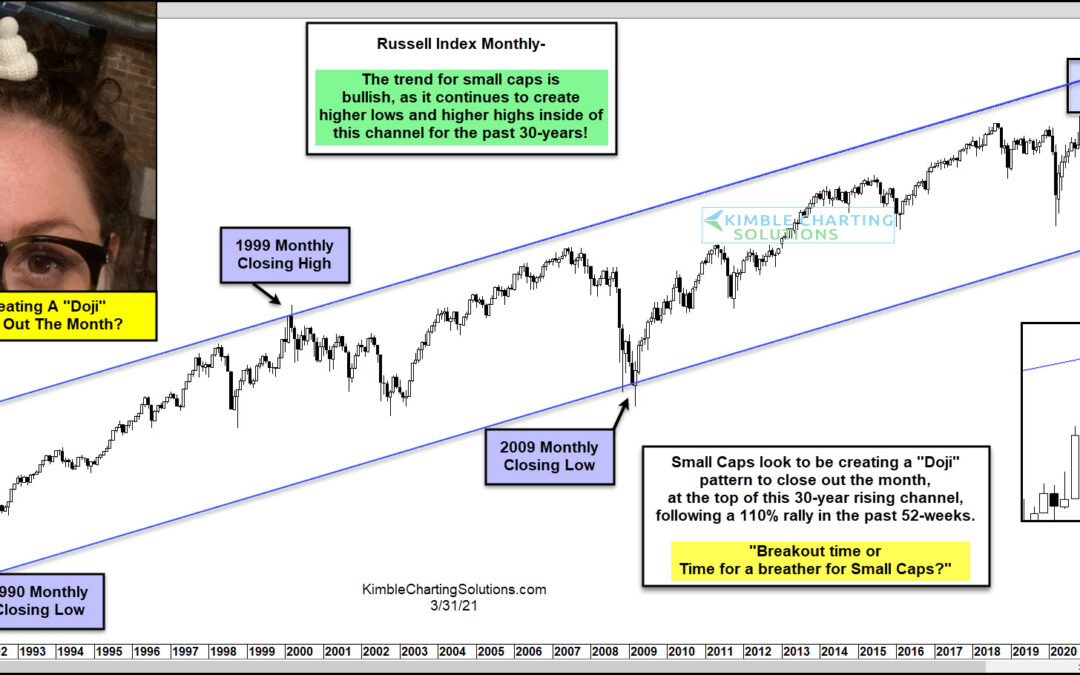
by Chris Kimble | Apr 1, 2021 | Kimble Charting
After months of strong bullish action for the small-cap stock index, the Russell 2000, chart patterns have turned indecisive. The broader trend is still bullish (higher highs and higher lows), but the month of March produced a Doji pattern. And this comes after a 110%...
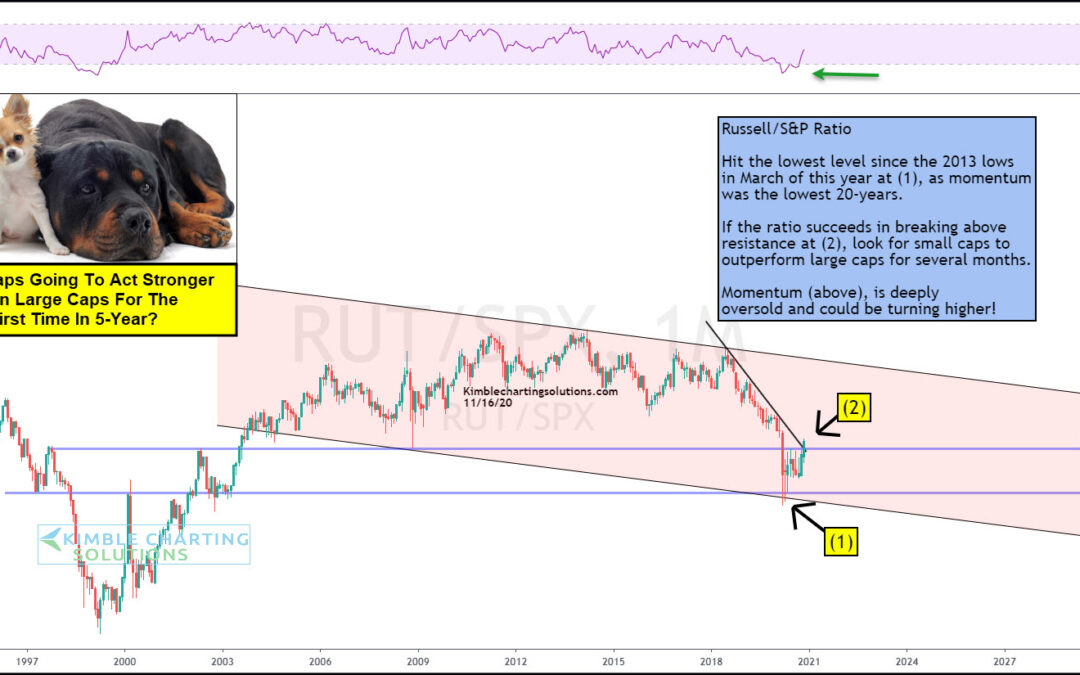
by Chris Kimble | Nov 16, 2020 | Kimble Charting
Small-cap stocks have underperformed large-cap stocks by a significant degree over the past 5-years. This weakness since the highs in 2015, has the Russell/S&P ratio hitting the lowest level in the past 15-years at (1), earlier this year. The rally off long-term...
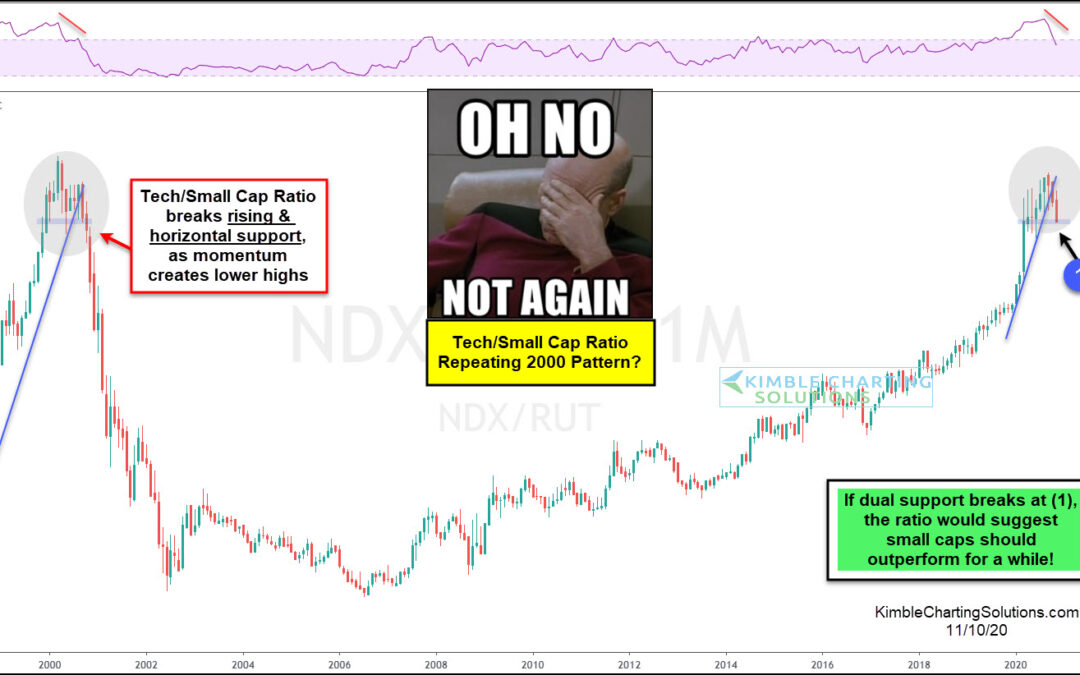
by Chris Kimble | Nov 11, 2020 | Kimble Charting
It’s always good to monitor the performance of market-leading sectors and indices. These leaders provide insight into the health of the bull market, potential trend changes, and/or the trend status of that particular sector or index. Today’s focus is on a long-term...
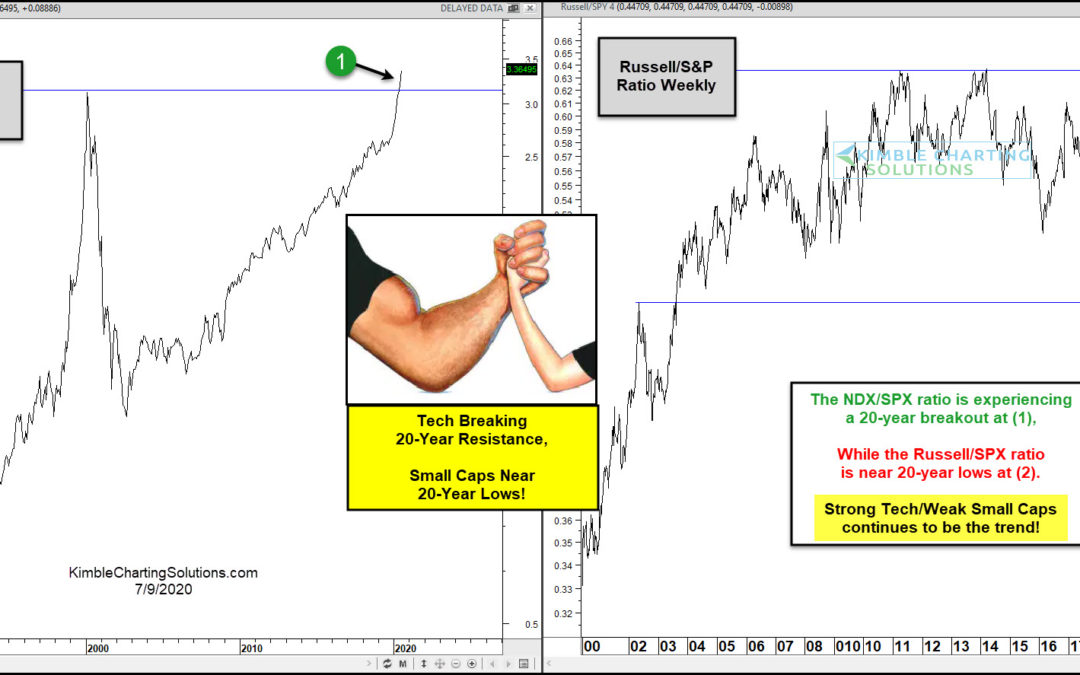
by Chris Kimble | Jul 9, 2020 | Kimble Charting
Successful investors are often rewarded by owning strength and avoiding weakness. Could two key sectors be experiencing 20-year strength and weakness extremes at the same time? Yes! The NDX 100/S&P ratio (left above) is currently experiencing a 20-year breakout at...
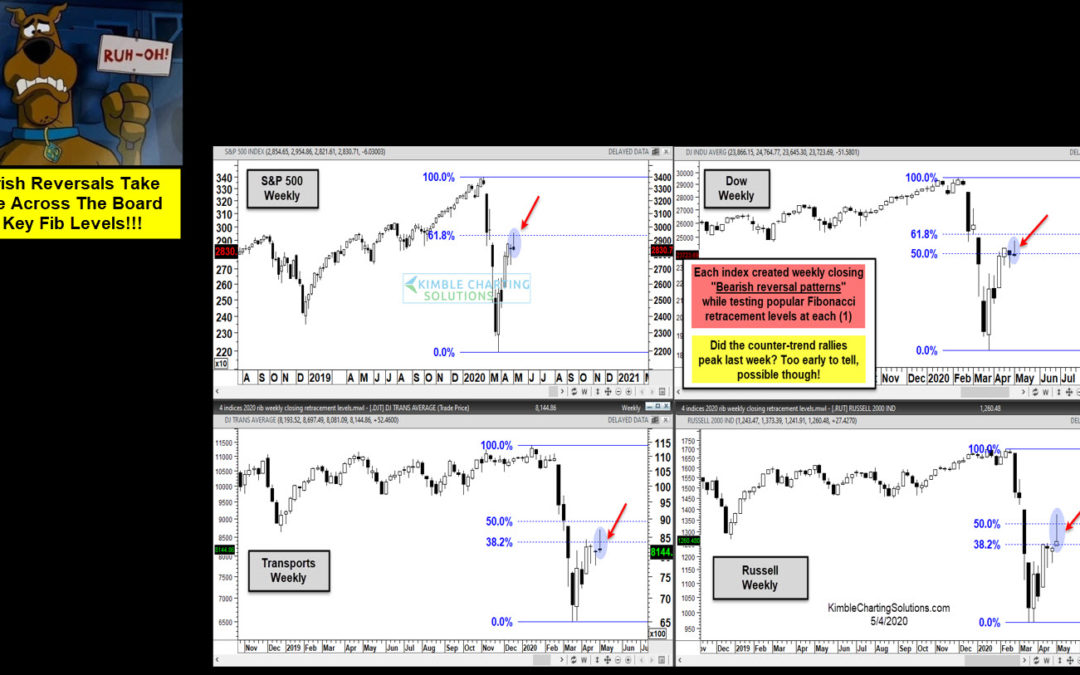
by Chris Kimble | May 4, 2020 | Kimble Charting
Is it Ruh-Roh Time for stock market bulls? Possible!!! Stock market bulls might have received a very concerning message last week from numerous indices! This 4-pack reflects that each popular index created a sizeable bearish reversal pattern at respective Fibonacci...
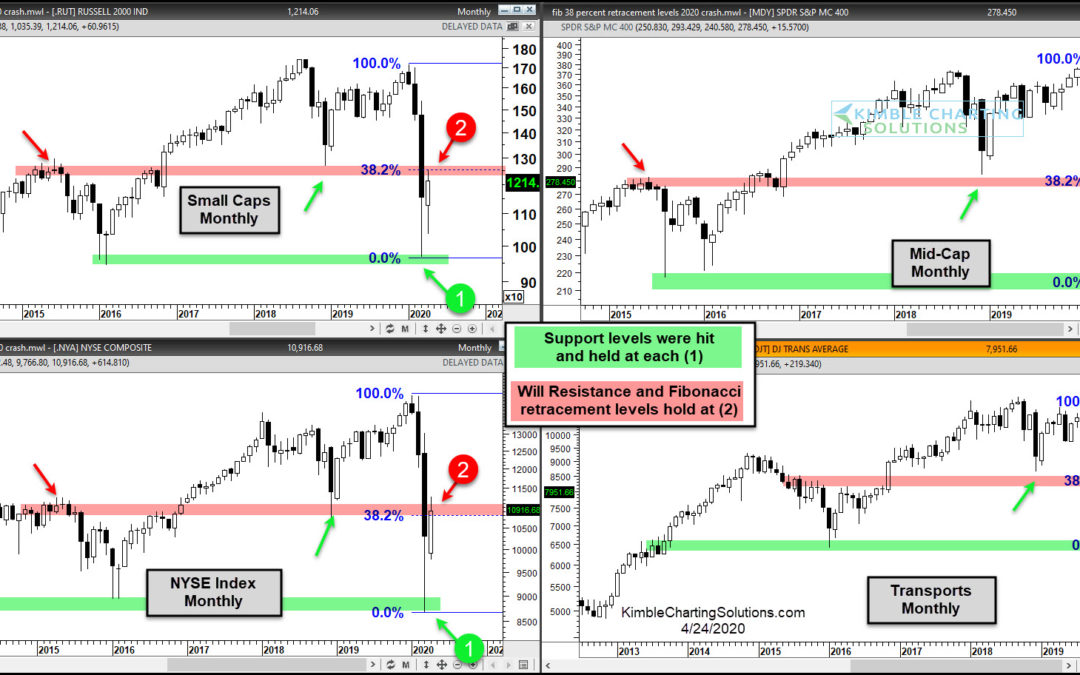
by Chris Kimble | Apr 24, 2020 | Kimble Charting
The bullish case for stocks is being put to an important price test here and now! This 4-pack reflects that “new resistance” and Fibonacci retracement levels are in play for each of these look-alike patterns. Each of these important indices hit long-term...
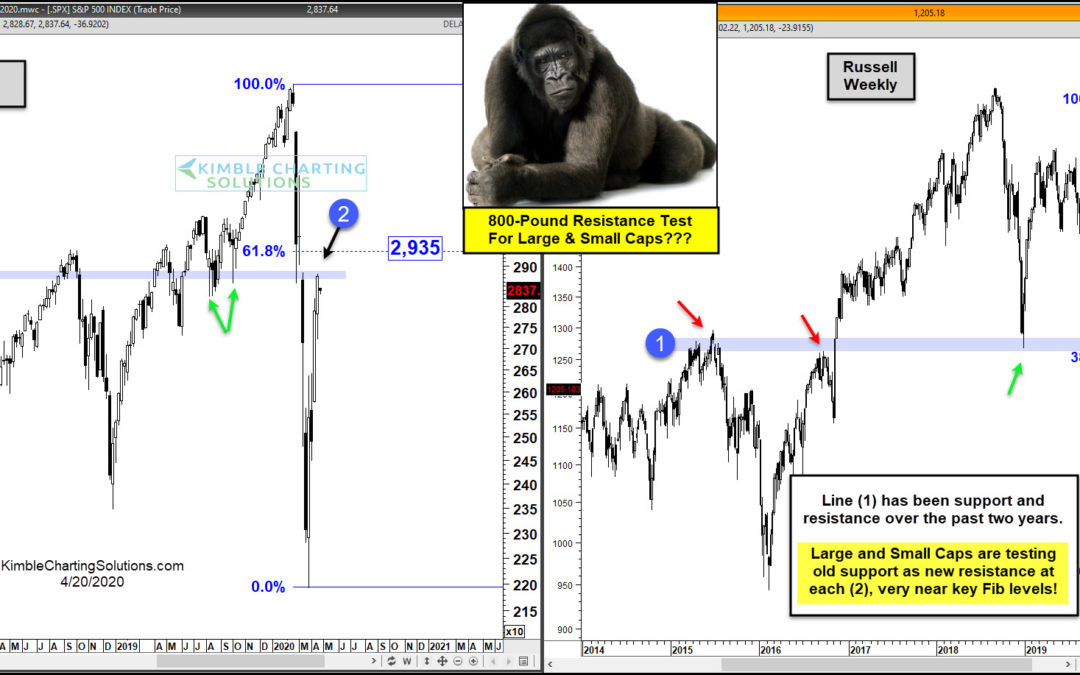
by Chris Kimble | Apr 21, 2020 | Kimble Charting
The stock market rally from the March crash lows has been sharp but lumpy. The S&P 500 Index and large cap stocks have lead the way higher, while the Russell 2000 Index and small cap stocks have lagged. That said, today’s chart highlights a significant overhead...
