by Chris Kimble | Nov 25, 2019 | Kimble Charting
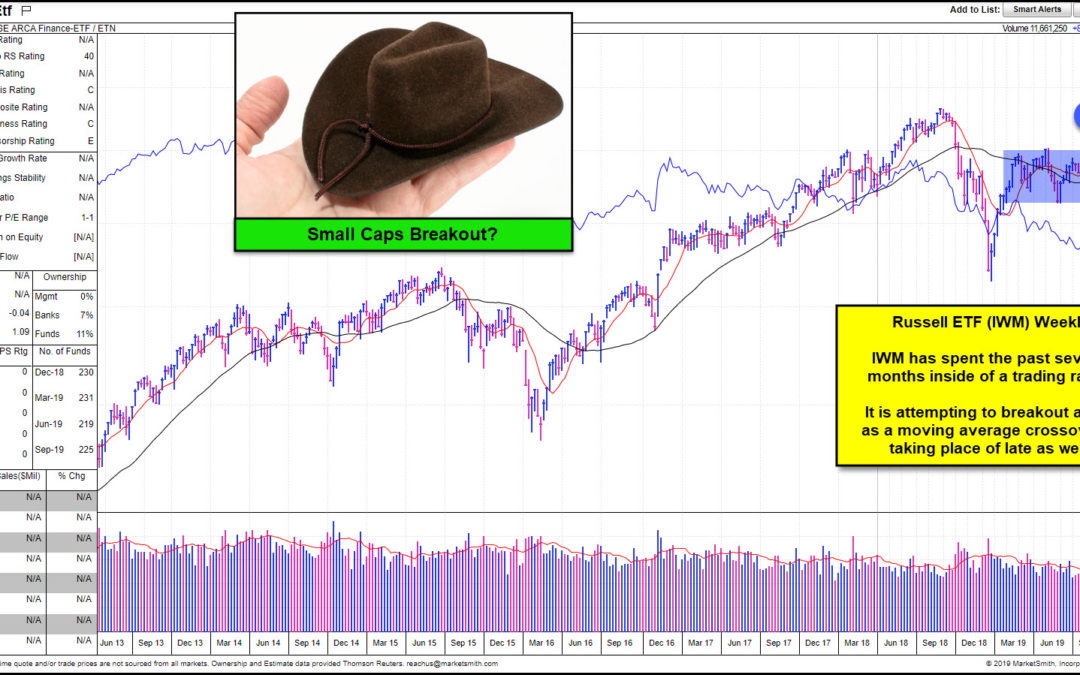
Small Caps (Russell 2000) have lagged large caps for nearly 18-months? Is it time for them to start outperforming large caps? What they do at (1) will send an important signal! The Russell ETF (IWM) has traded sideways for the past 6-months, inside of the blue shaded...
by Chris Kimble | Jul 31, 2019 | Kimble Charting
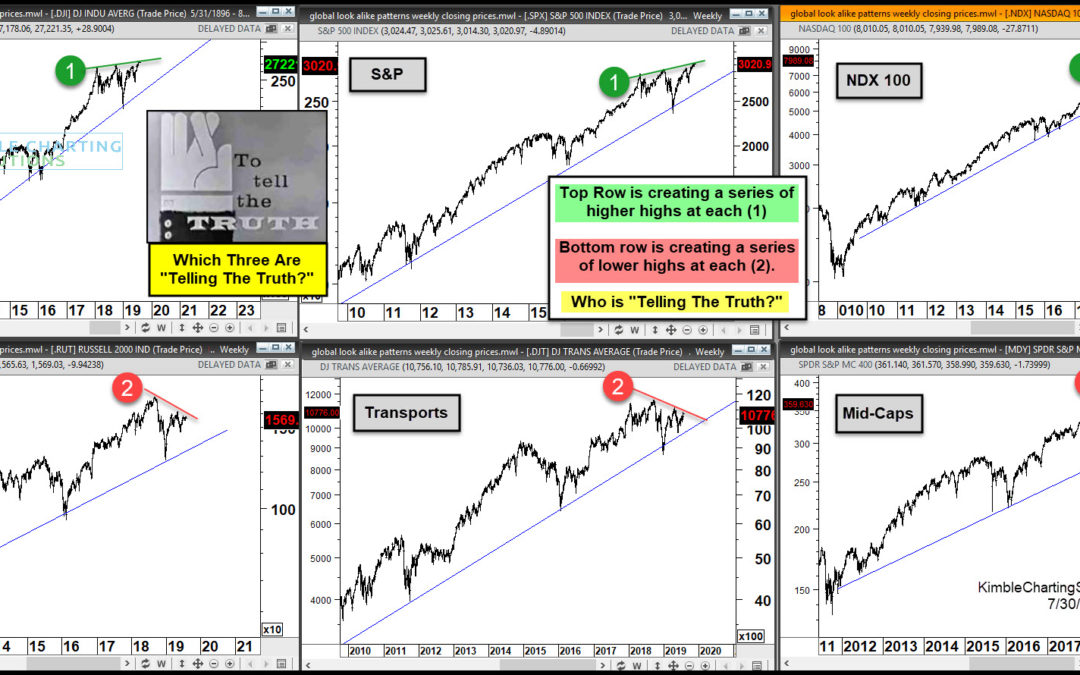
As investors prepare for the Federal Reserve announcement today, they are feeling pretty good. That’s mostly due to the performance of the “big 3” stock market indexes: the S&P 500 IndexINDEXSP: .INX, Dow Jones IndustrialsINDEXDJX: DJI, and the NasdaqINDEXNASDAQ:...
by Chris Kimble | Jan 18, 2019 | Kimble Charting
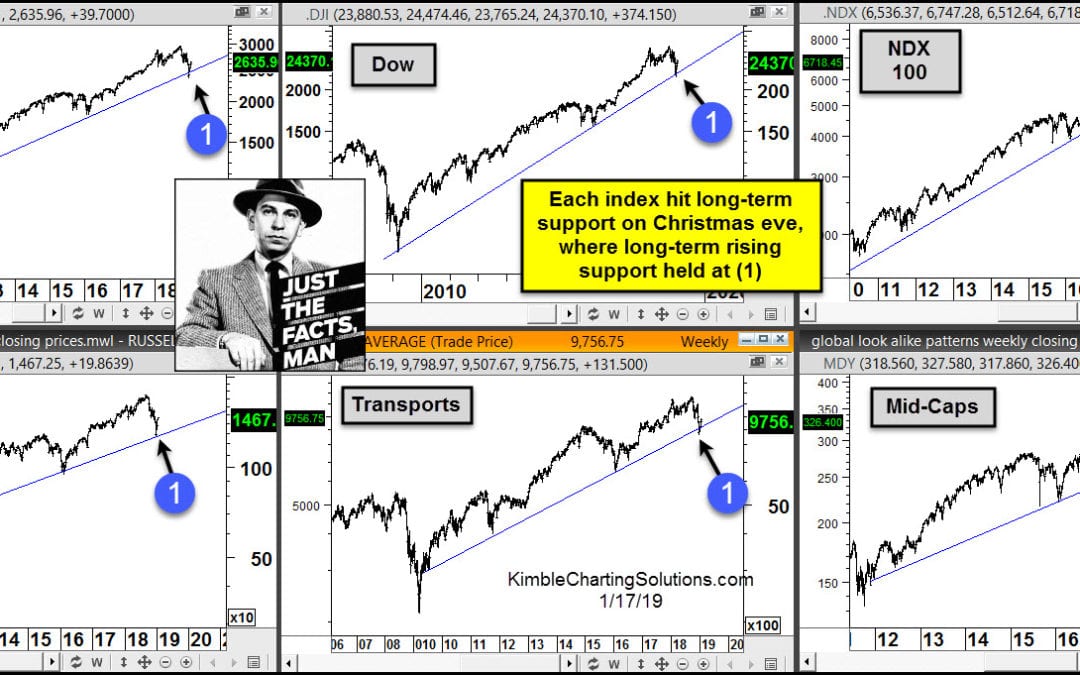
We often hear “Stocks take an escalator up and an elevator down!” No doubt stocks did experience a swift decline from the September highs to the Christmas eve lows. Looks like the “elevator” part of the phrase came true as 2018 was coming to an...
by Chris Kimble | Dec 21, 2018 | Kimble Charting
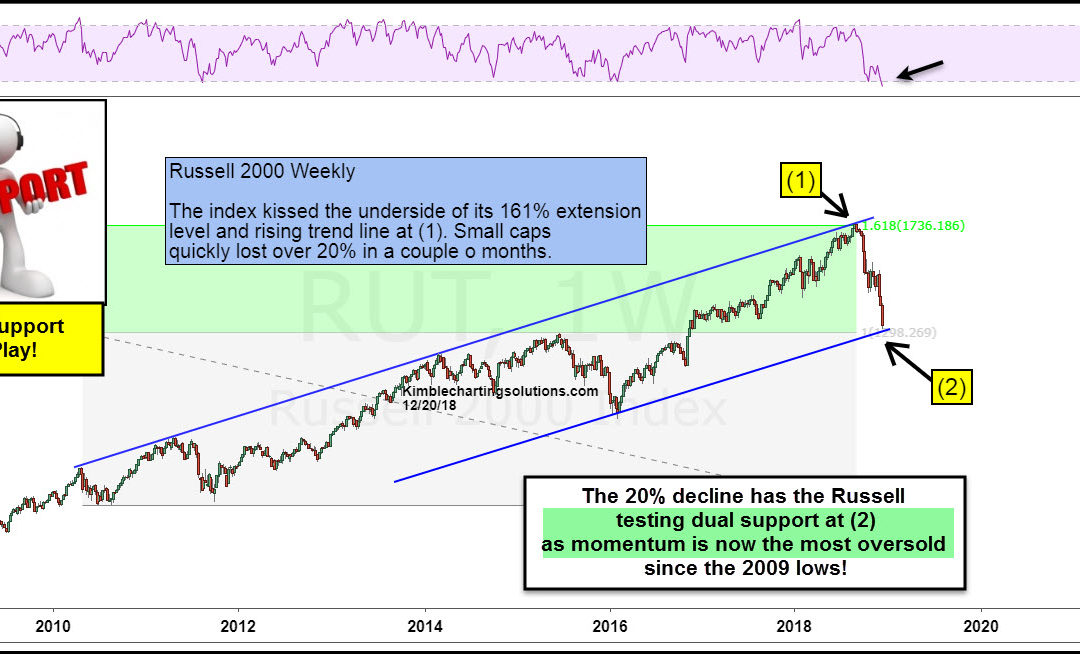
The Russell 2000 it’s 161% Fibonacci extension level in August and (1), where it quickly reversed and declined more than 20%! The swift decline now has small caps testing rising support and its 2015 highs at (2). While it is testing dual support, weekly momentum...
by Chris Kimble | Dec 7, 2018 | Kimble Charting
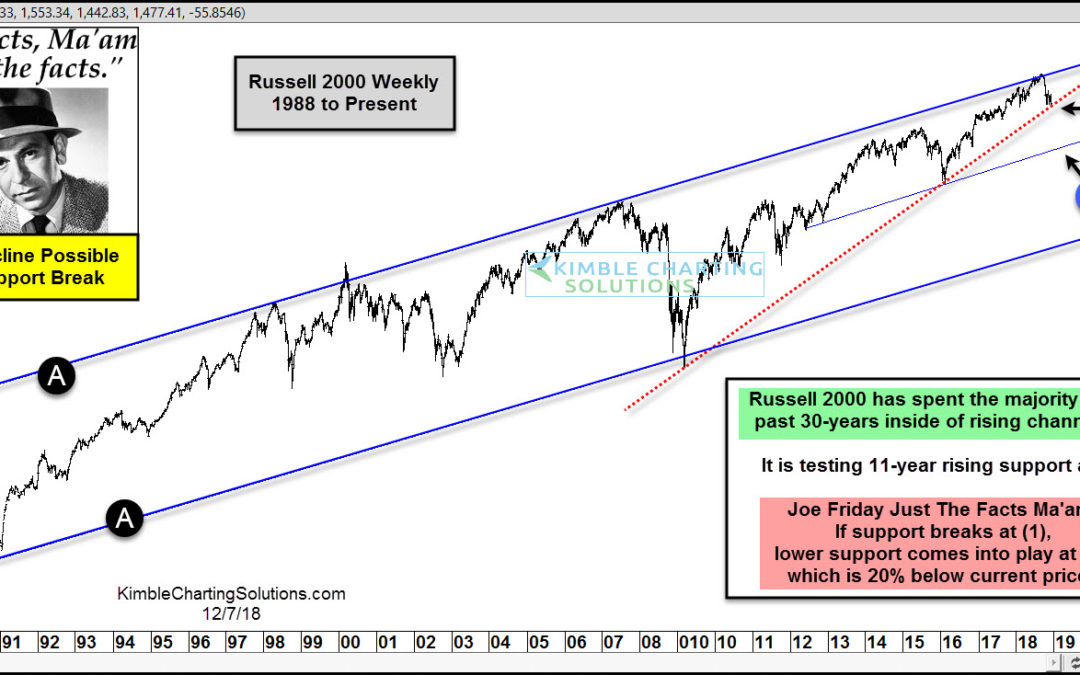
This chart looks at the Russell 2000 over the past 30-years, where it has spent the majority of that time, inside of rising channel (A). This chart reflects that the long-term trend in small caps remains higher. Weakness this year has it testing rising support tied to...
by Chris Kimble | Aug 17, 2018 | Kimble Charting
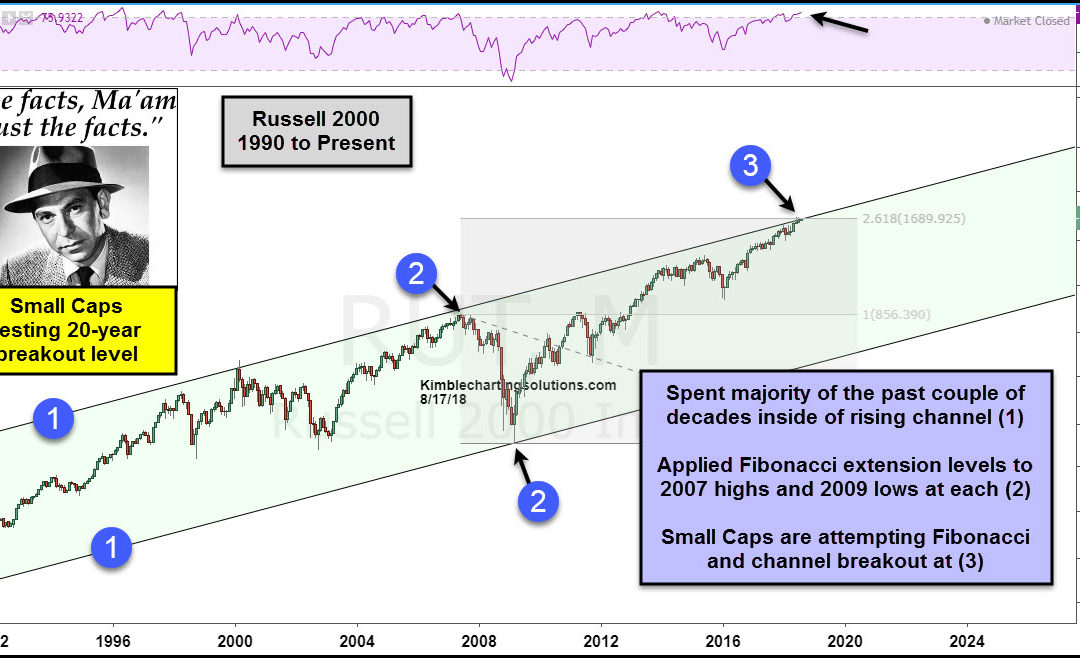
CLICK ON CHART TO ENLARGE The Russell 2000 trend remains solidly higher, as it has created a series of higher lows and higher highs inside of rising channel (1) over the past 25-years. Small caps have been an upside leader in 2018, as they are very near all-time...
by Chris Kimble | May 30, 2018 | Kimble Charting
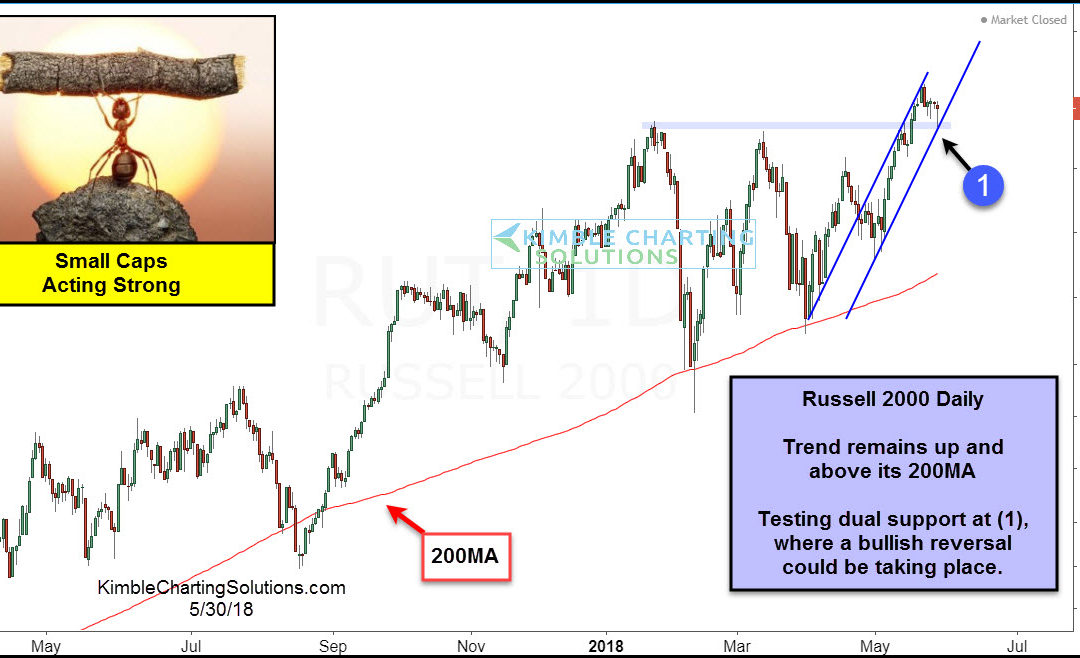
CLICK ON CHART TO ENLARGE Few stock indices can brag about hitting all-time highs of late. Two indices that can are Micro and Small Caps, as each recently hit all-time highs. Above looks at the Russell 2000 index over the past 13-months, which reflects that the trend...
by Chris Kimble | Apr 7, 2018 | Kimble Charting
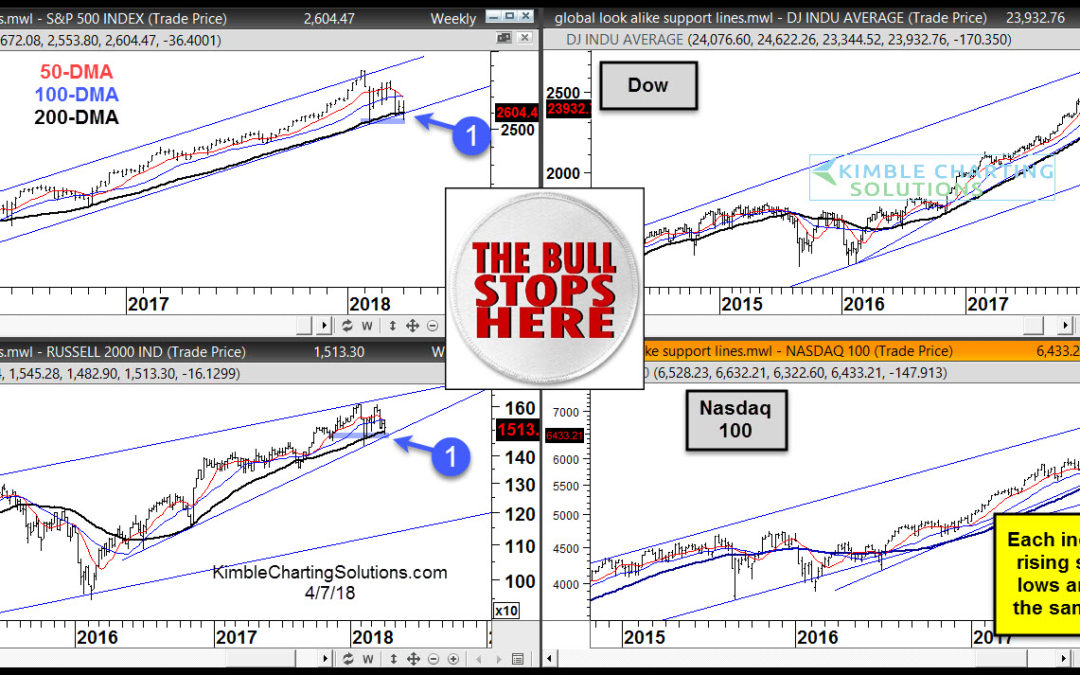
CLICK ON CHART TO ENLARGE The definition of a bull market or bull trends widely vary. One of the more common criteria for bull markets is determined by the asset being above or below its 200 day moving average. In my humble opinion, each index above remains in a bull...


