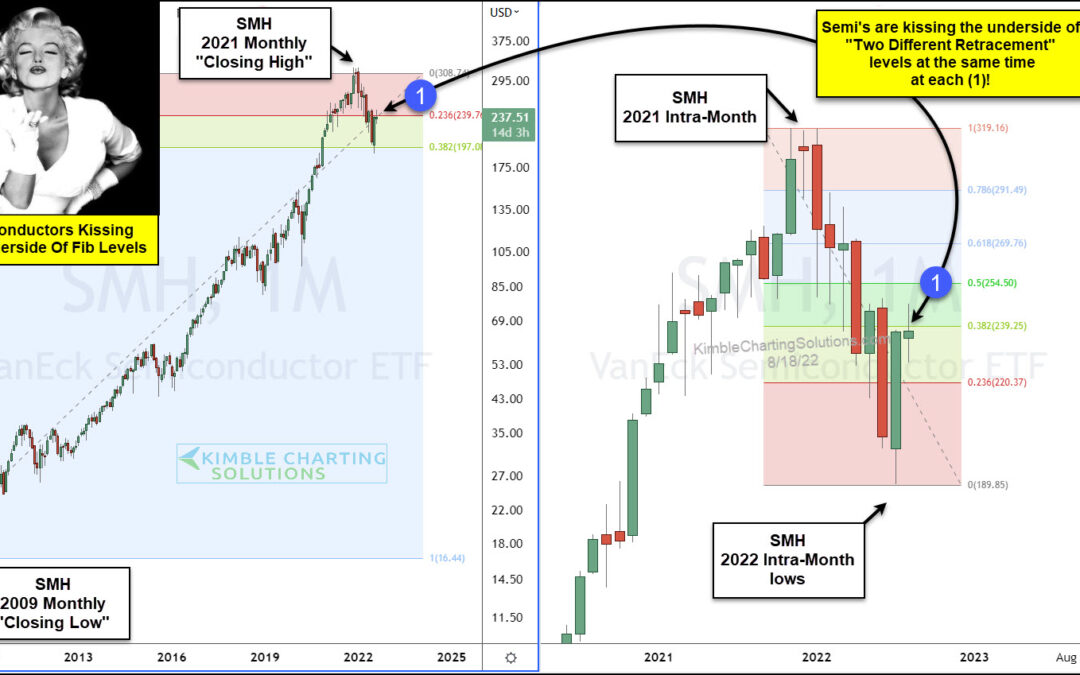
by Chris Kimble | Aug 18, 2022 | Kimble Charting
Make no mistake about it, Semiconductors are an important leader within the technology sector. They lead the market higher… and lower. This year’s bear market is a great example as the Semiconductor Sector (SMH) began underperforming in late 2021 and lead the market...
by Chris Kimble | Jul 1, 2022 | Kimble Charting
It is imperative for active investors to understand the importance of market leadership, both on the way up and down. And this is proving to be very true of the Semiconductors sector. The Semis played a HUGE role in the tech bull market, helping to push the Nasdaq and...
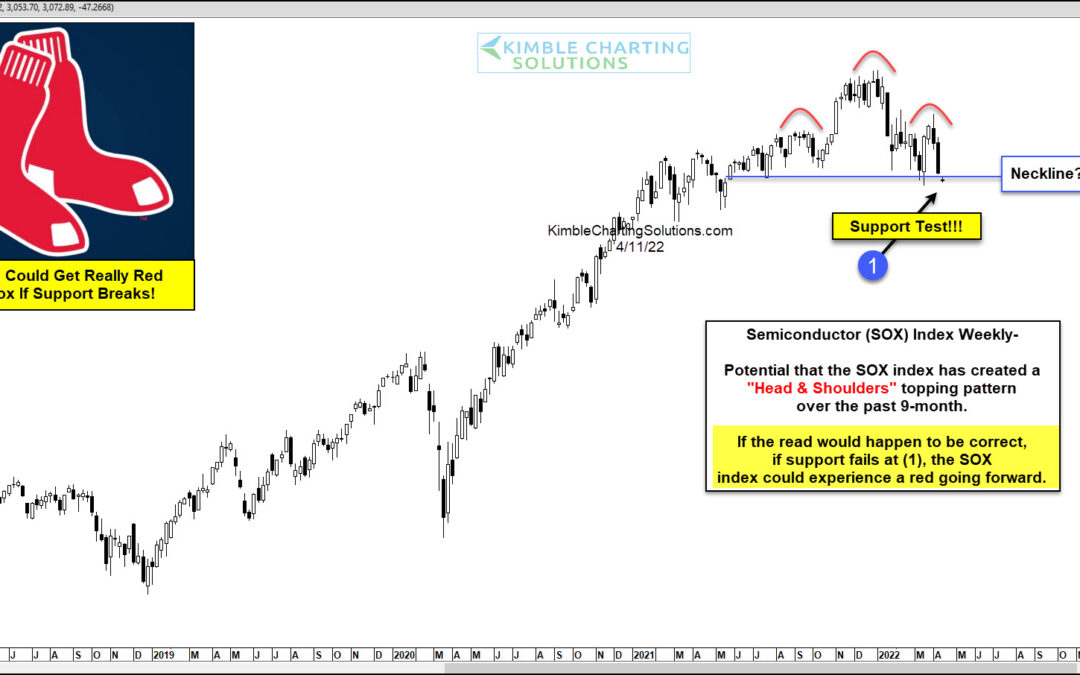
by Chris Kimble | Apr 12, 2022 | Kimble Charting
Today we share another important chart for the Semiconductors. Why? Because they are a market leader that has fallen on hard times this year. And, as you may have noticed, we always bring to light the latest reversals and key tests of support/resistance in an effort...
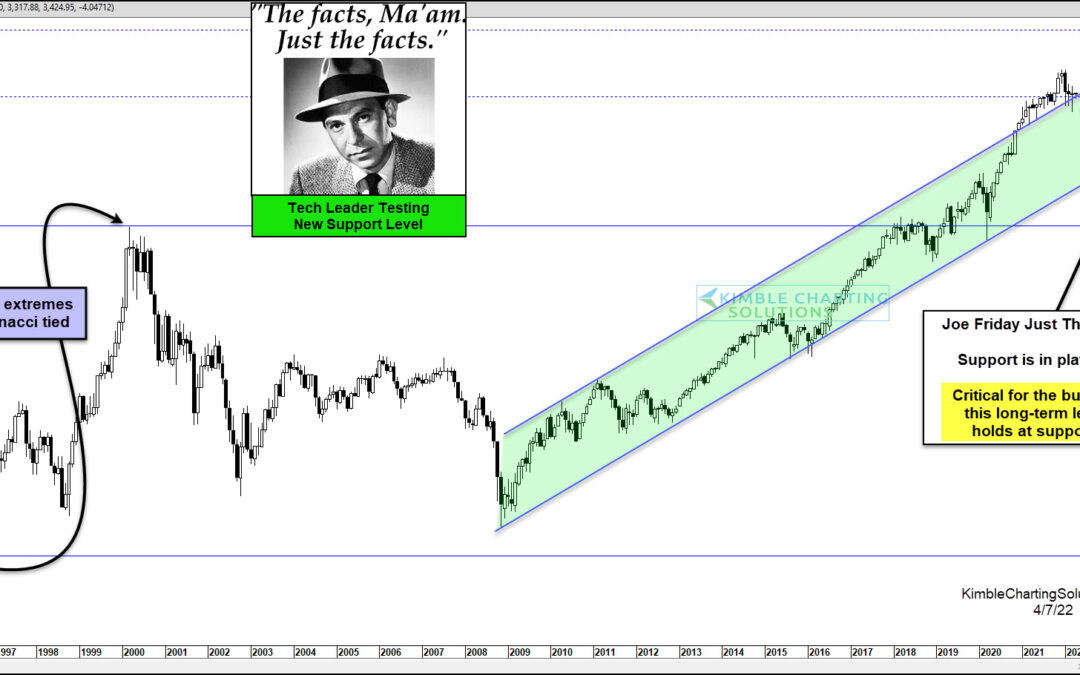
by Chris Kimble | Apr 8, 2022 | Kimble Charting
In any bull market, it’s important to identify sector leadership. That helps us trend follow on lesser time periods and to identify bigger inflection points on broader time periods. Today’s focus will be on the tech-leading Semiconductor Sector (SMH). And as Joe...
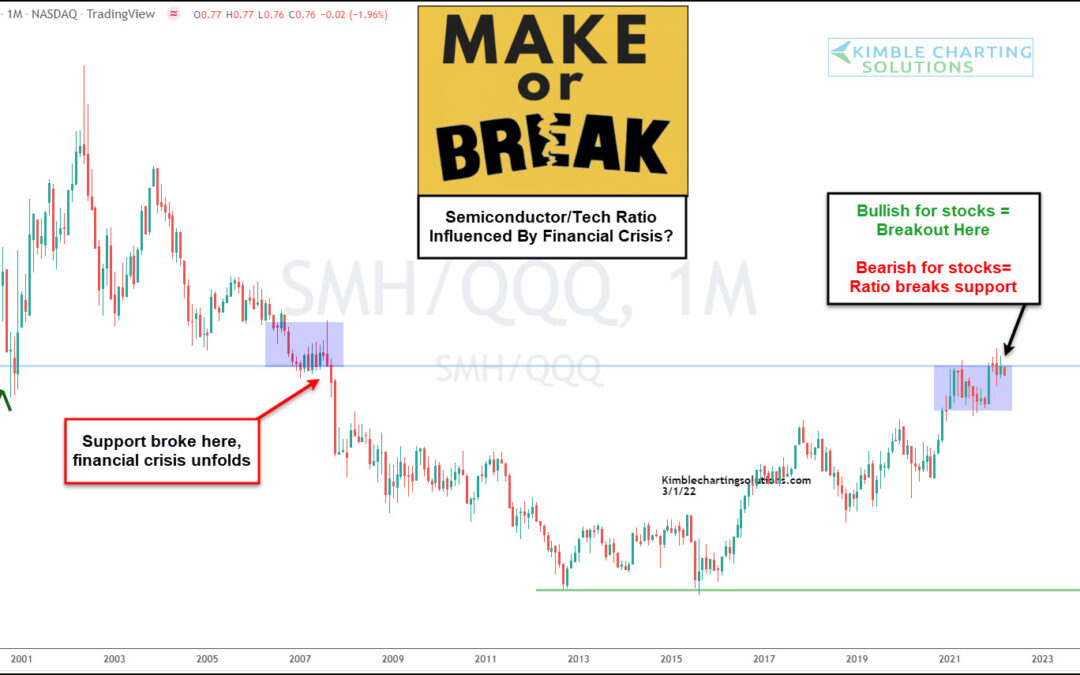
by Chris Kimble | Mar 2, 2022 | Kimble Charting
Over the past two decades, it’s fair to say that semiconductor stocks have been an important part of the technology space. This is true from an investing and economic perspective. Today’s chart looks at a long-term view of the ratio of the Semiconductor ETF to the...
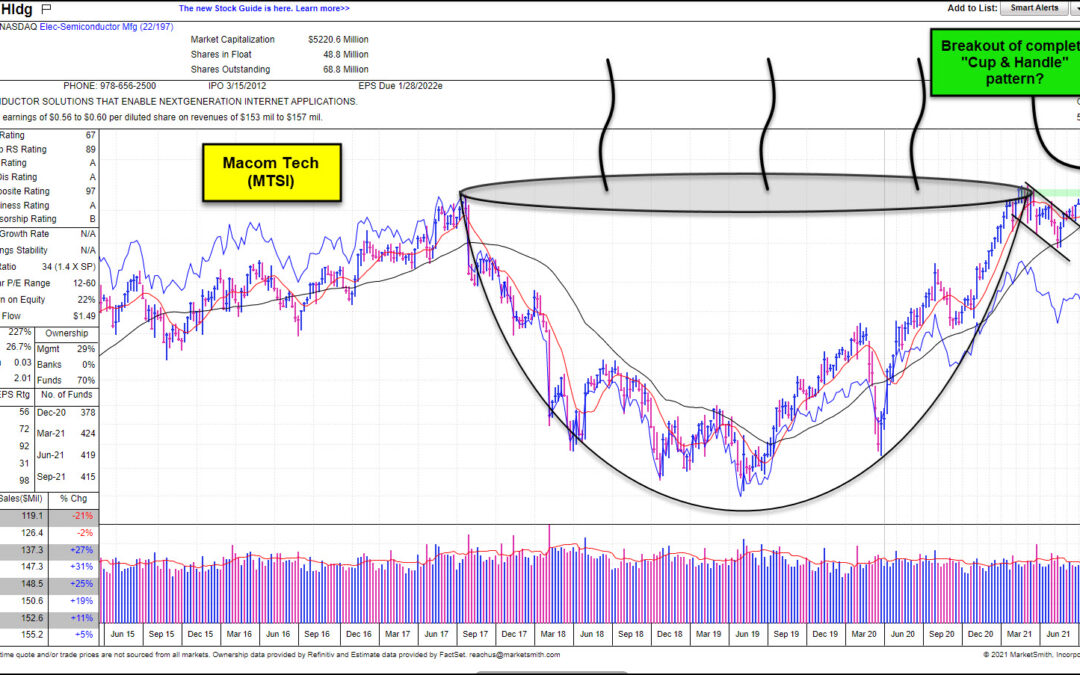
by Chris Kimble | Nov 5, 2021 | Kimble Charting
With the U.S. stock market in bull-mode and tech stocks surging, there is no shortage of strong stocks out there. Today, we share a tech stock that is breaking out of a very bullish price cup with handle pattern: Macom Technology Solutions (MTSI). As you can see,...
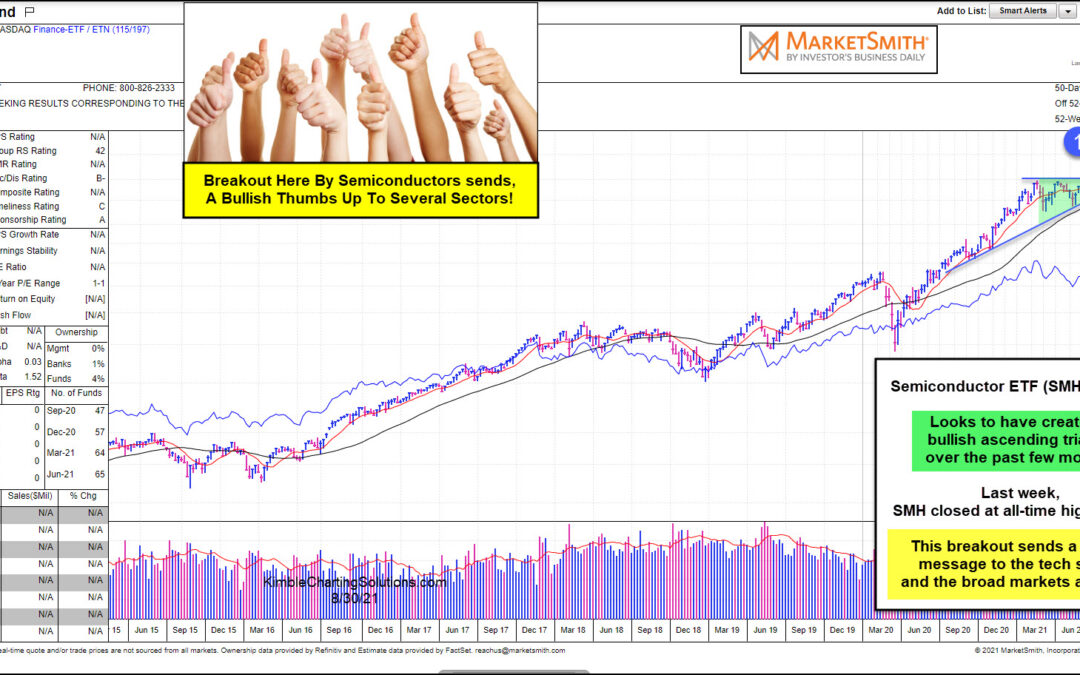
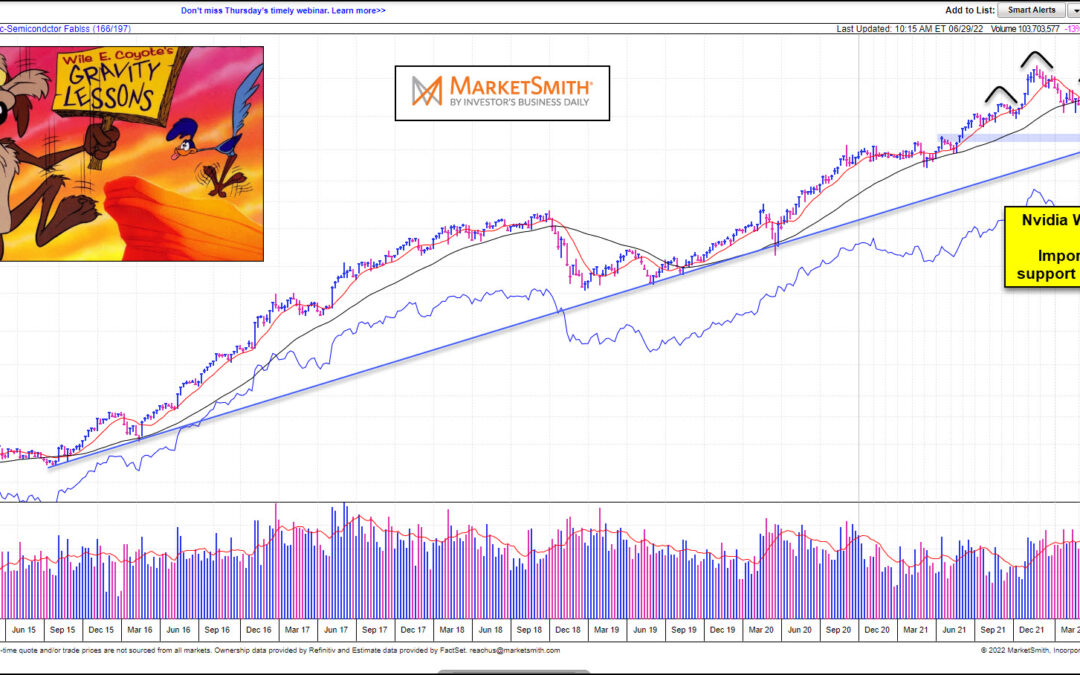
by Chris Kimble | Aug 31, 2021 | Kimble Charting
The semiconductors sector has always been a great read for the pulse of the technology economy (and Nasdaq Composite) reflected from this chart from Marketsmith.com Tech investors often look to the Semiconductors for leadership… and when they are leading (or breaking...
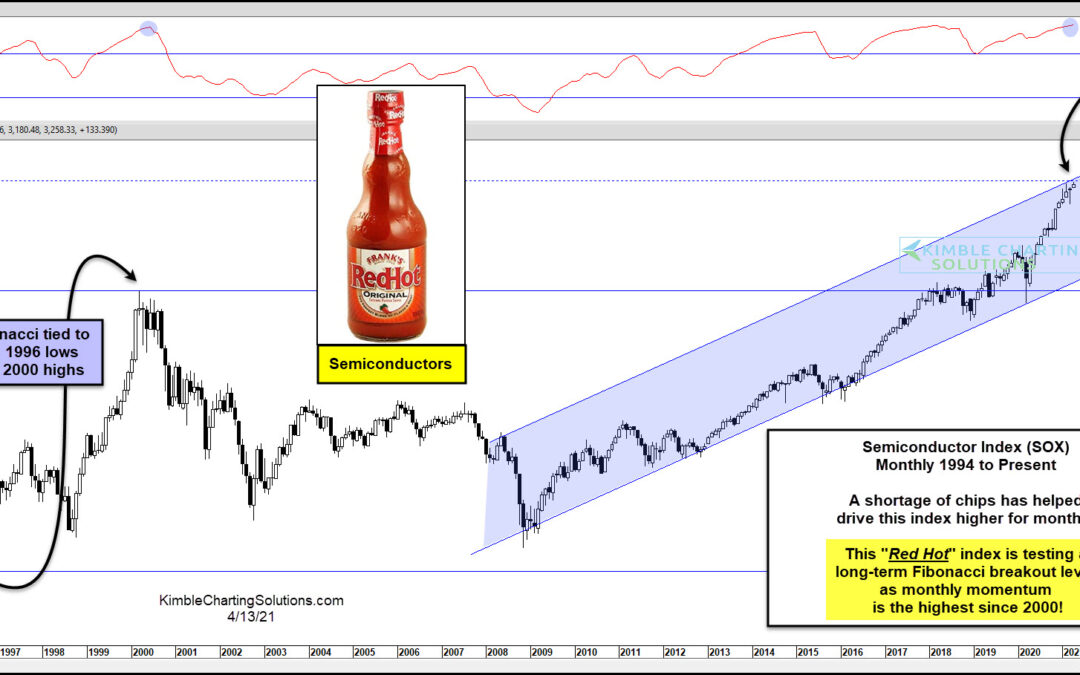
by Chris Kimble | Apr 13, 2021 | Kimble Charting
Will the “Red Hot” semiconductor index cool off or get even hotter due to the shortage of chips? This chart looks at the Semiconductor Index on a monthly basis over the past quarter-century. No doubt the trend is up as it has created a series of higher...
