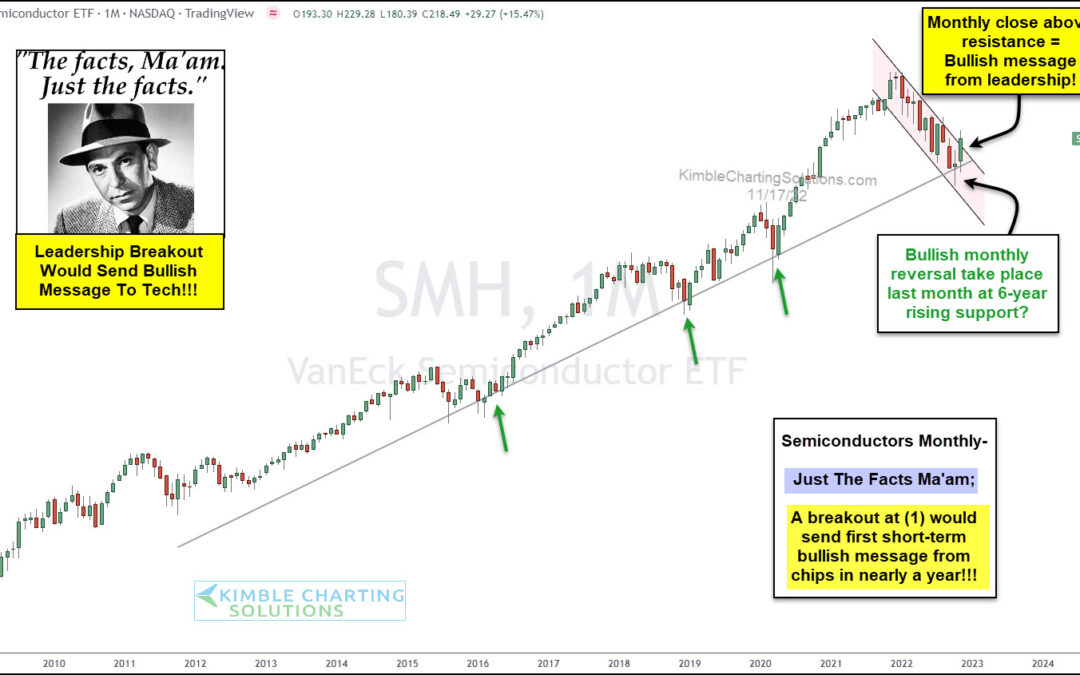
by Chris Kimble | Nov 18, 2022 | Kimble Charting
Over the past decade, we have written A LOT about the importance of following the technology sector as a leading indicator of the health of the market. And, in particular, the Semiconductors. Why? Because the Semi’s have been an important leader of the bull market...
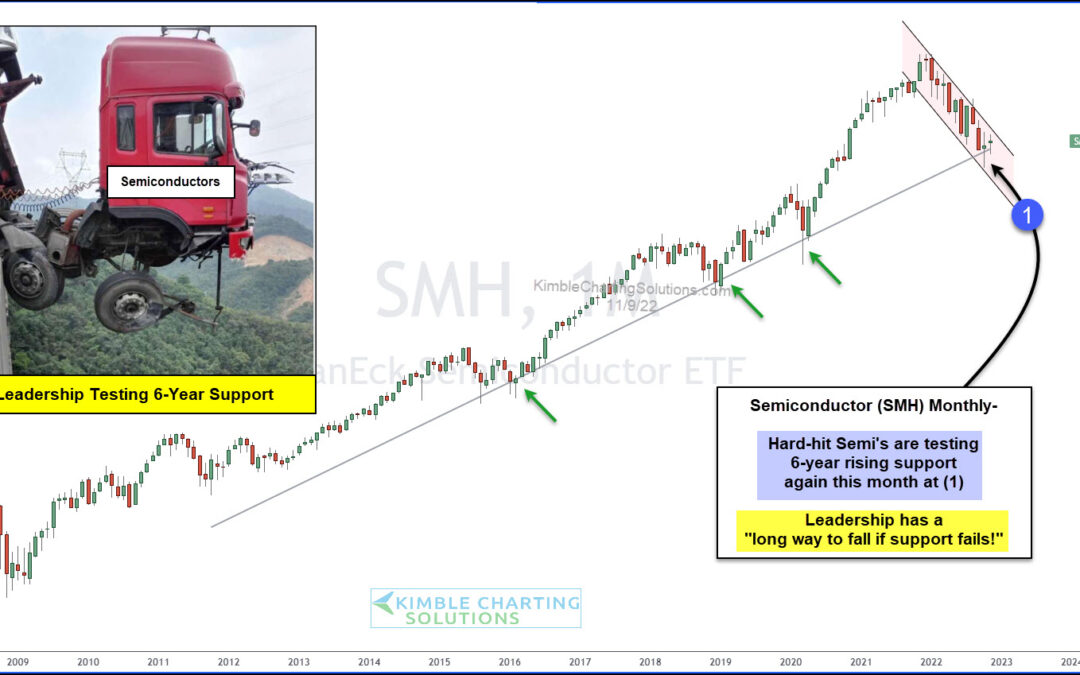
by Chris Kimble | Nov 10, 2022 | Kimble Charting
We have spent countless time on research highlighting the turn lower in the tech leading Semiconductors. It’s been nearly a year and the Semiconductors Sector (SMH) has endured quite a fall. Can bulls swoop in and save the Semis? If so, it needs to happen soon! Today,...
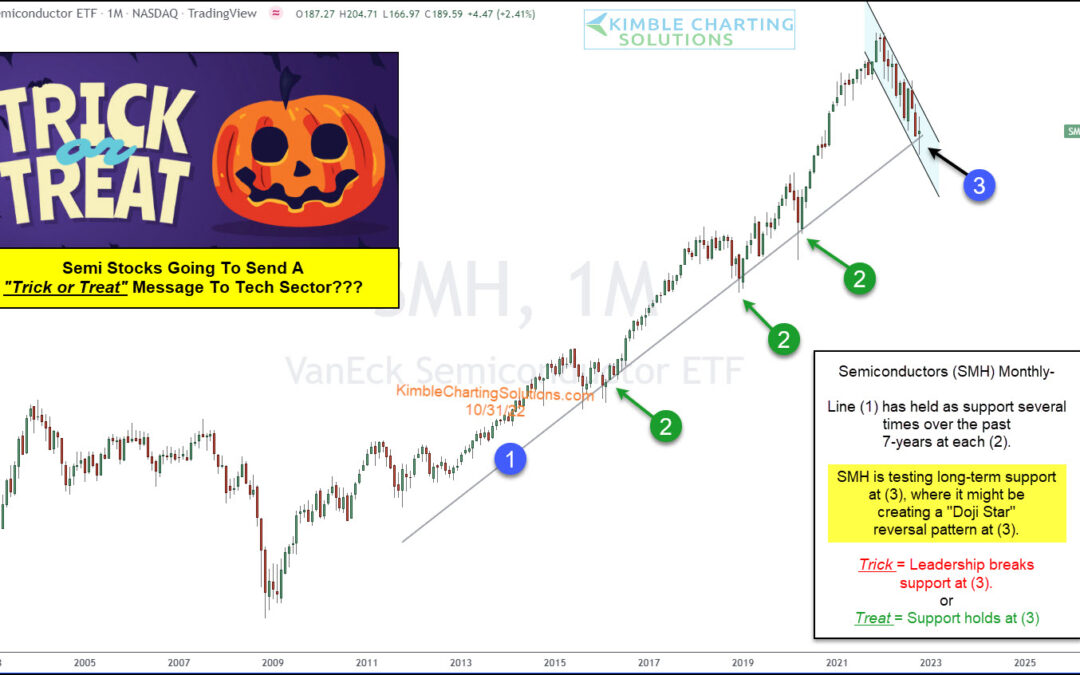
by Chris Kimble | Oct 31, 2022 | Kimble Charting
This is apparent when looking at the performance ratio of the Nasdaq Composite to S&P 500 Index. Tech is extremely important to the broader stock market and has been a market leader over the past decade-plus. But as October comes to a close and the masses welcome...
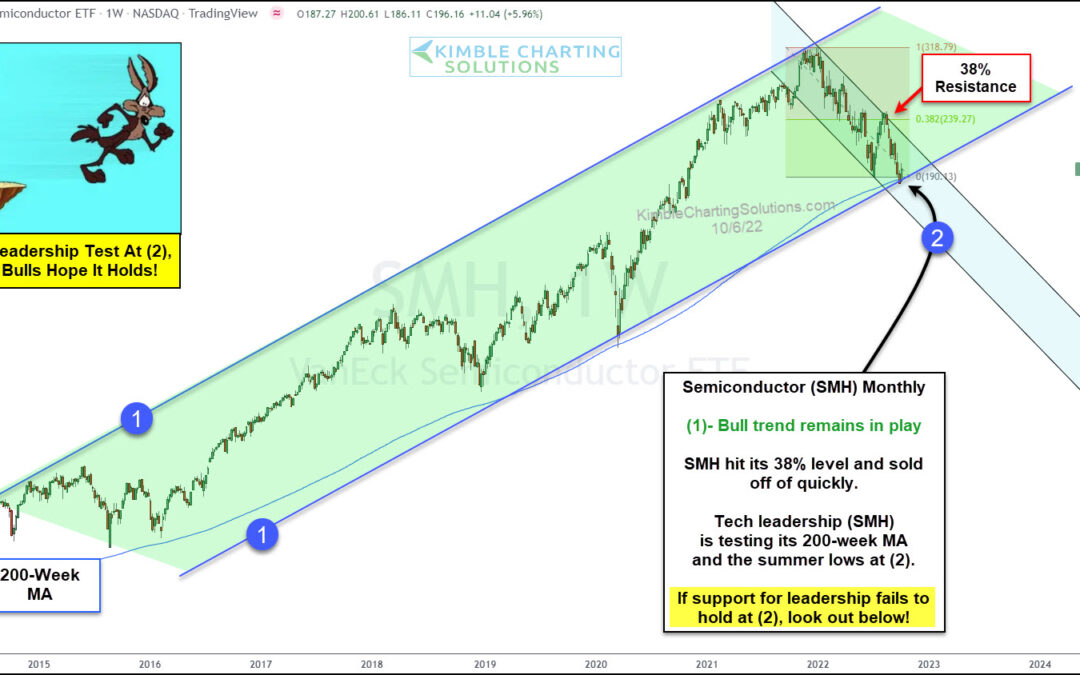
by Chris Kimble | Oct 7, 2022 | Kimble Charting
The stock market bounced a little bit this week but several sectors and indices are still in trouble. One such sector is the tech leadership group, the Semiconductors $SMH. And we have written no shortage of articles on this key sector. Check out these recent...
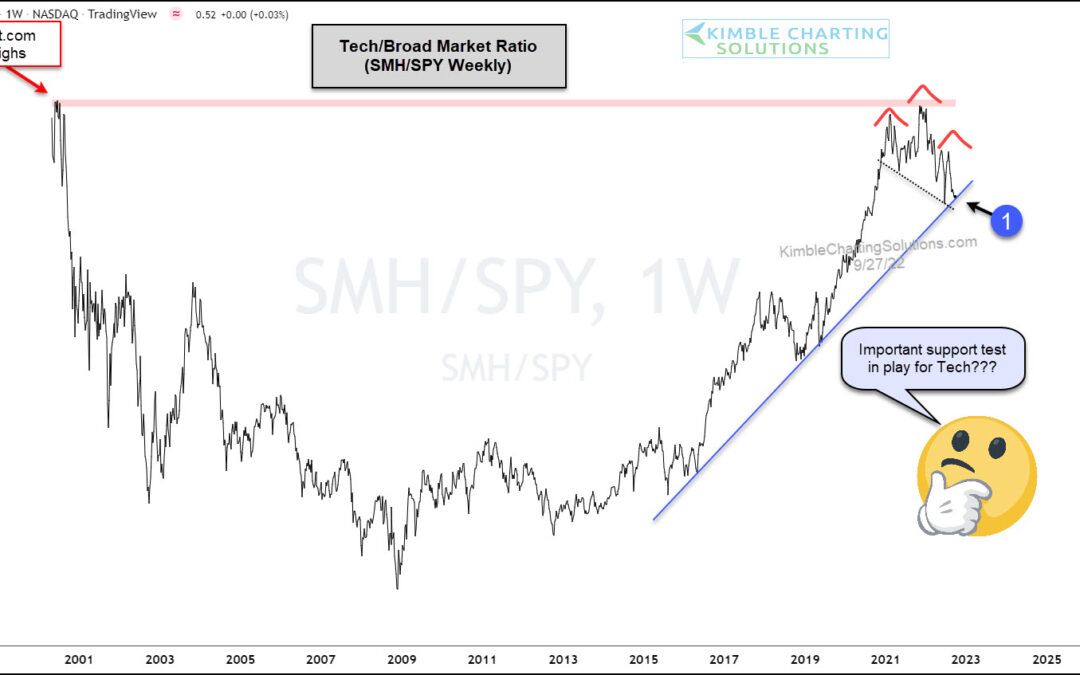
by Chris Kimble | Sep 28, 2022 | Kimble Charting
Today we revisit an incredibly important stock market ratio: The Semiconductors Sector $SMH versus the S&P 500 $SPY. This ratio highlights how an important tech leadership group is performing versus the broad market. And considering that tech stocks lead the...
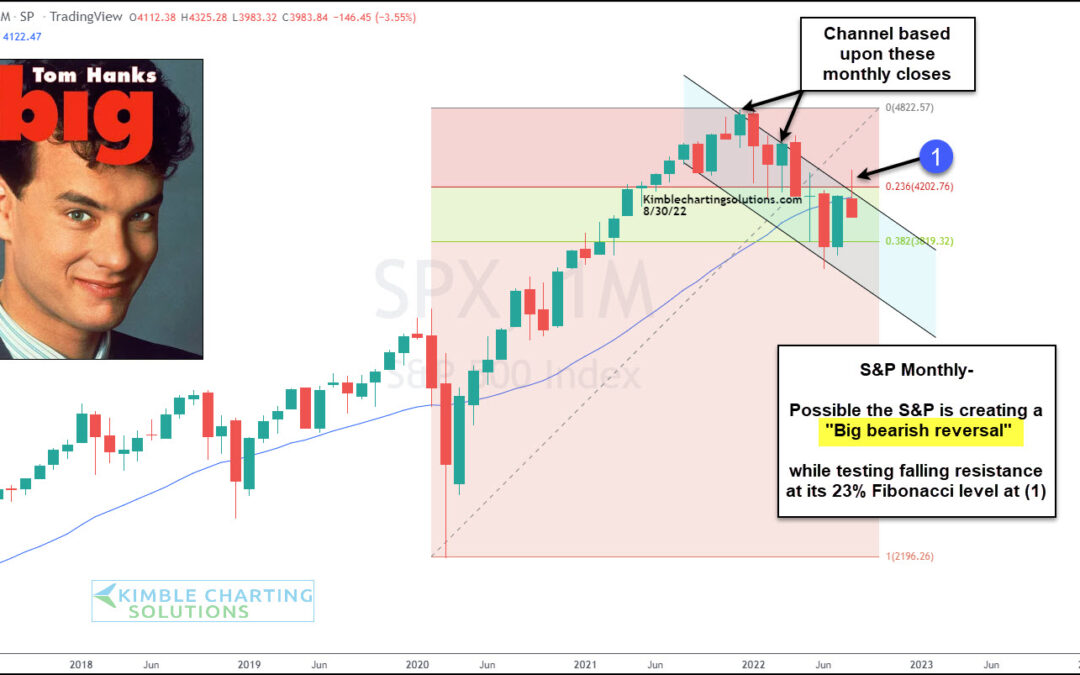
by Chris Kimble | Sep 1, 2022 | Kimble Charting
The stock market is falling once again, with the S&P 500 Index trading nearly 10 percent lower than its high just weeks ago. In fact, that reaction high occurred this month so the “monthly” candle is creating a very big bearish reversal. You can see this on...
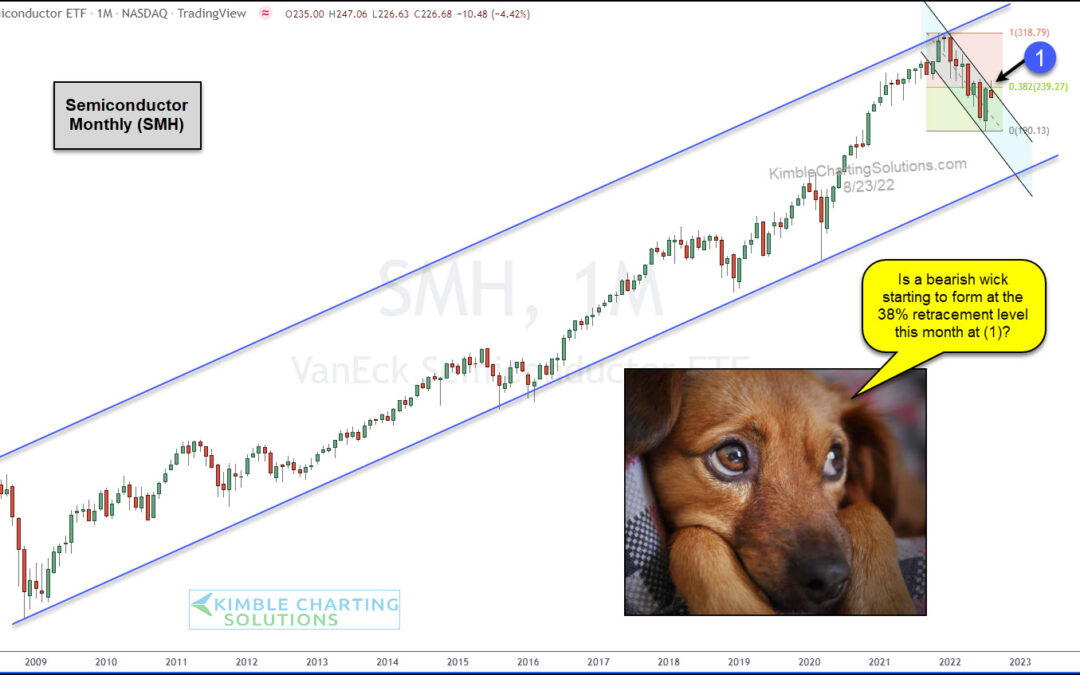
by Chris Kimble | Aug 23, 2022 | Kimble Charting
We talk a lot about the importance of watching the performance of market leading stocks and sectors. And just last week we highlighted that the Semiconductor Sector (SMH) was nearing its 38.2% Fibonacci level. Well, that level is already showing its importance and has...
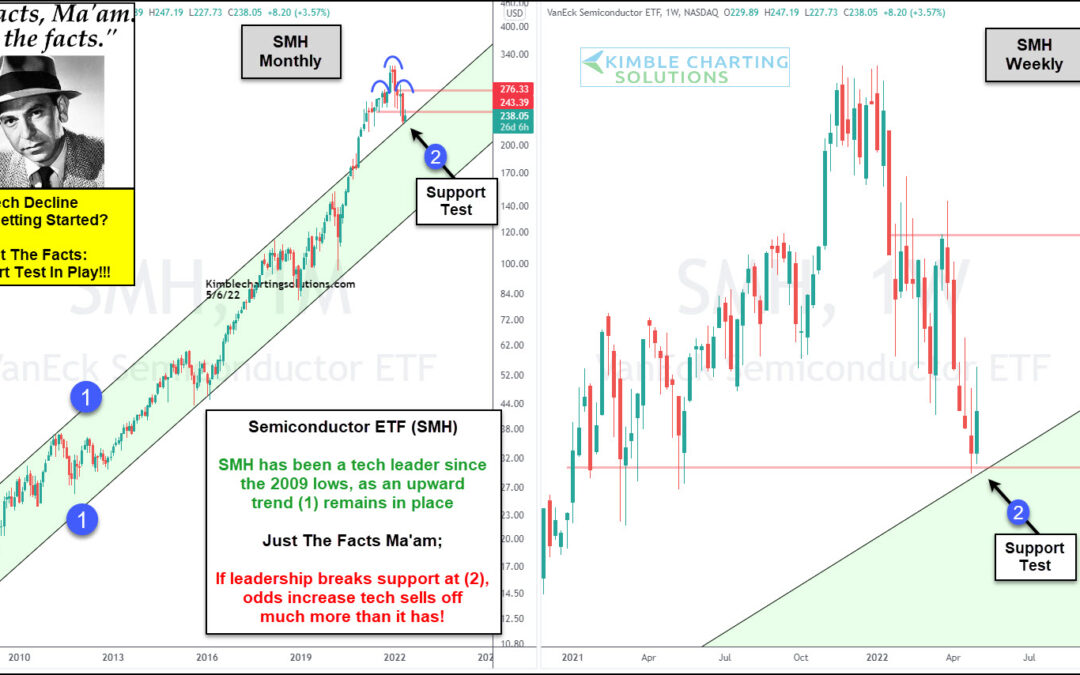
by Chris Kimble | May 6, 2022 | Kimble Charting
It has been a volatile week for the stock market, and technology stocks have taken another turn lower. As we look to Friday and the end of the week, it’s time to check in on our often-followed tech leader: The Semiconductors Sector. We have placed a lot of focus on...
