
by Chris Kimble | Mar 20, 2014 | Kimble Charting
CLICK ON CHART TO ENLARGE Is a 3% decline for a currency in a couple of months, enough of a decline? The left chart reflects that the Chinese Yuan to the U.S. Dollar started falling two months ago and its been a hard and swift decline, to say the least. Do the...

by Chris Kimble | Mar 12, 2014 | Kimble Charting
CLICK ON CHART TO ENLARGE Doc Copper are you feeling ok, you don’t look the best! Copper could well be forming a multi-year descending triangle. If this pattern read is correct, should Copper break support, selling pressure should increase....

by Chris Kimble | Mar 10, 2014 | Kimble Charting
CLICK ON CHART TO ENLARGE Is it important what one sixth of the worlds population does? I believe its worth paying attention too for sure! The Shanghai index has had a rough go of it since the highs of 2009, losing over half its value. So far this large decline...

by Chris Kimble | Feb 25, 2014 | Kimble Charting
CLICK ON CHART TO ENLARGE The Shanghai Index, Copper and Freeport McMoran look to be forming Descending triangle patterns. If you are unfamiliar with this pattern please read about them here Bottom line to this pattern, a break of support suggests a...

by Chris Kimble | Jan 28, 2014 | Kimble Charting
CLICK ON CHART TO ENLARGE My Mentor, Sir John Templeton, was a strong believer in “buy at the point of maximum pessimism!” Unless you live under a rock, you are well aware that Emerging markets have not only had a few rough years, they’ve also...

by Chris Kimble | Jan 22, 2014 | Kimble Charting
CLICK ON CHART TO ENLARGE If you don’t like the idea that China could fall another 50% and Commodities could lose another 30% – “Don’t shoot the messenger….shoot the pattern and the traders around the world that have formed...
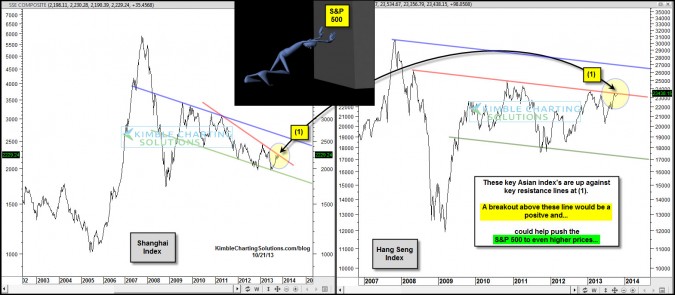
by Chris Kimble | Oct 21, 2013 | Kimble Charting
CLICK ON CHART TO ENLARGE 2013 hasn’t been kind to all stock index’s, especially when it comes to key Asian stock markets! The chart below reflects that the Hang Seng and the Shanghai Index are lagging the S&P 500’s performance by a large margin...

by Chris Kimble | Sep 20, 2013 | Kimble Charting
CLICK ON CHART TO ENLARGE The Shanghai Index and CRB (Commodity Index) have both formed “Bearish Descending Triangle” patterns. Using history as a guide, the majority of the time this pattern suggests lower prices are ahead for both of these. What would...
