by Chris Kimble | Mar 15, 2022 | Kimble Charting
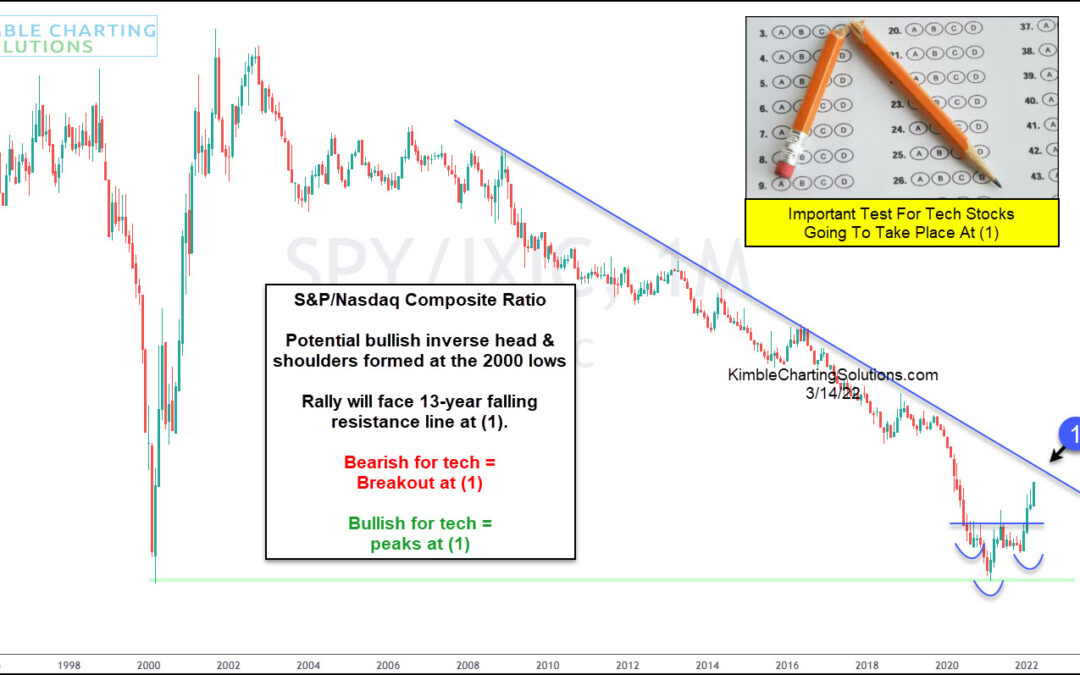
Over the past several months, growth stocks have begun to fall behind value stocks. And this theme can easily be seen in the growth-oriented Nasdaq Composite. Technology stocks have been a market leader for much of the past two decades. But this trend/theme appears to...
by Chris Kimble | Jan 26, 2022 | Kimble Charting
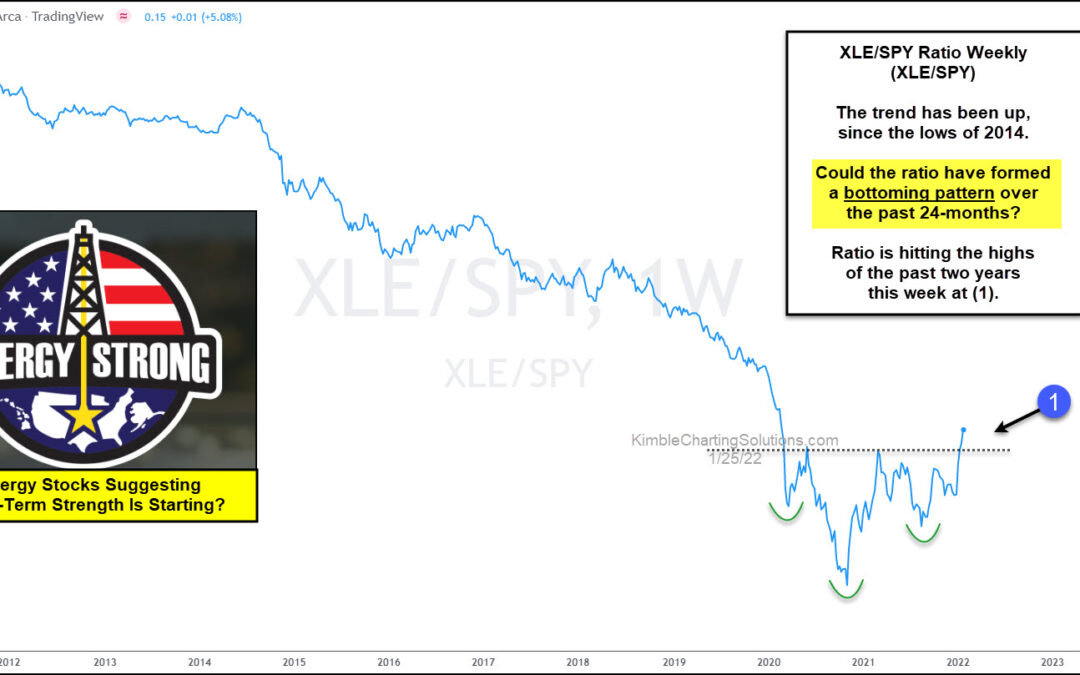
Energy stocks spent the decade of 2010 to 2020 mired in weakness… but is that trend coming to an end? The past two years have seen the Energy Sector (XLE) surge as Crude Oil has rallied back over $80. Today’s chart is a long-term “weekly” ratio chart of the Energy...
by Chris Kimble | Apr 16, 2020 | Kimble Charting
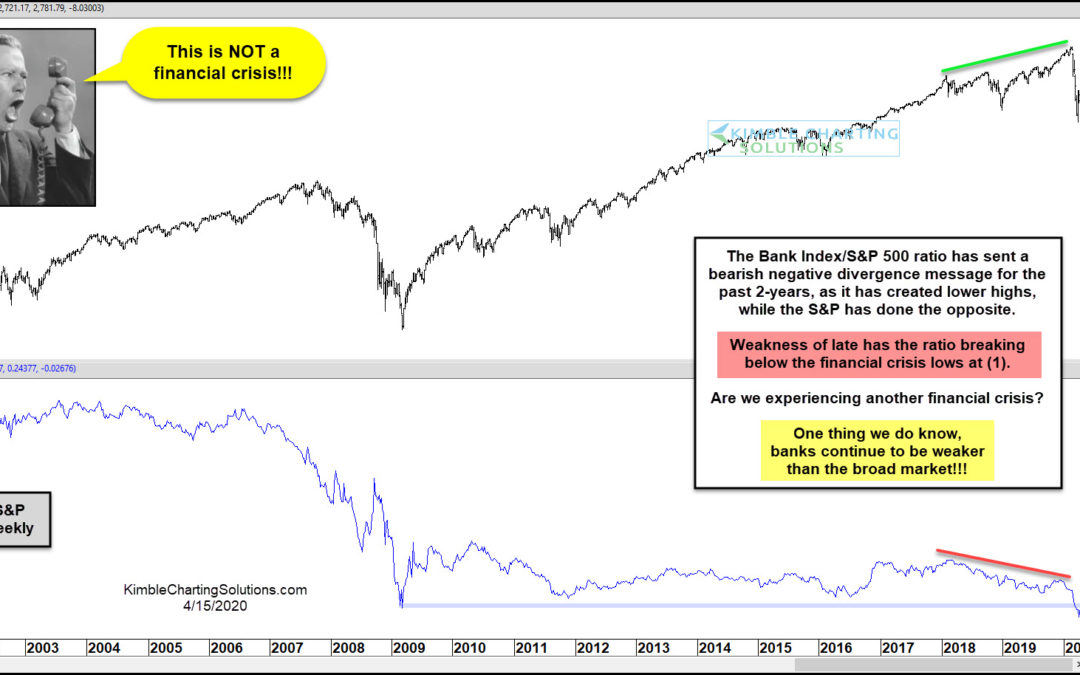
S&P 500 Index (top pane) vs Bank Index to S&P 500 Ratio (lower pane) As most investors know, the banks play a big role in the overall economy. Healthy banks tend to mean a healthy economy and struggling banks tend to mean an uneven or faltering economy. In...
by Chris Kimble | Mar 30, 2020 | Kimble Charting
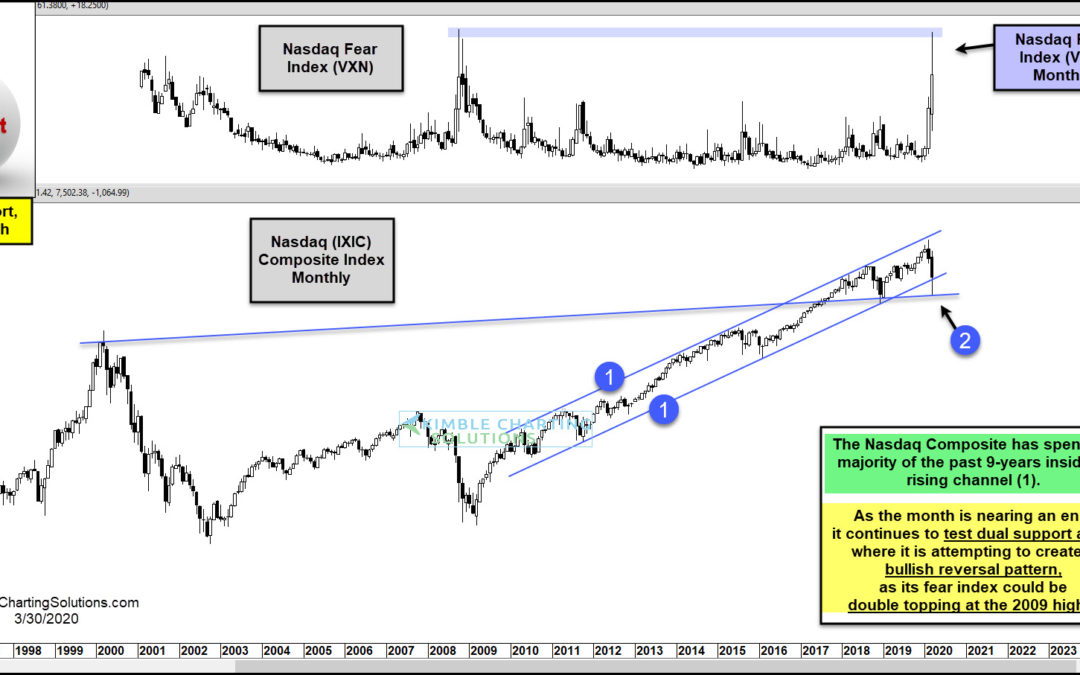
Is an important Tech Index sending a bullish message to investors? It is making an attempt! Does that mean a low in this important sector is in play? Humbly it is too soon to say at this time! This chart looks at the Nasdaq Composite Index over the past 25-years on a...
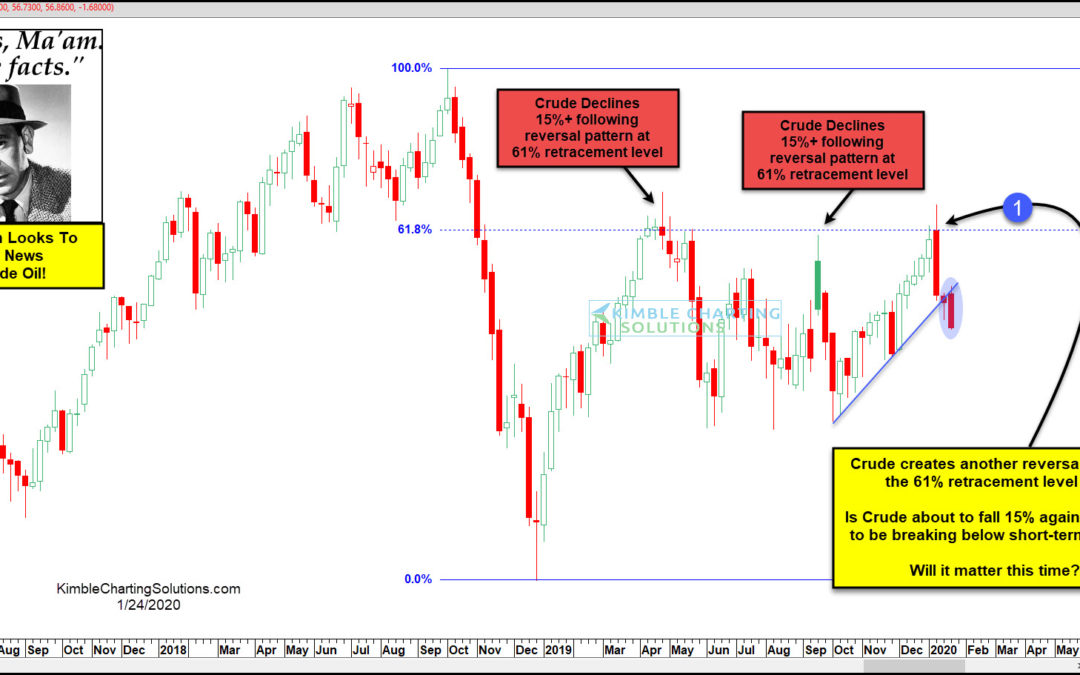
by Chris Kimble | Jan 24, 2020 | Kimble Charting
It’s a good idea for investors to be aware of key indicators and inter-market relationships. Perhaps it’s watching the US Dollar as an indicator for precious metals or emerging markets. Or watching interest rates for the economy. Experience, history, and relationships...
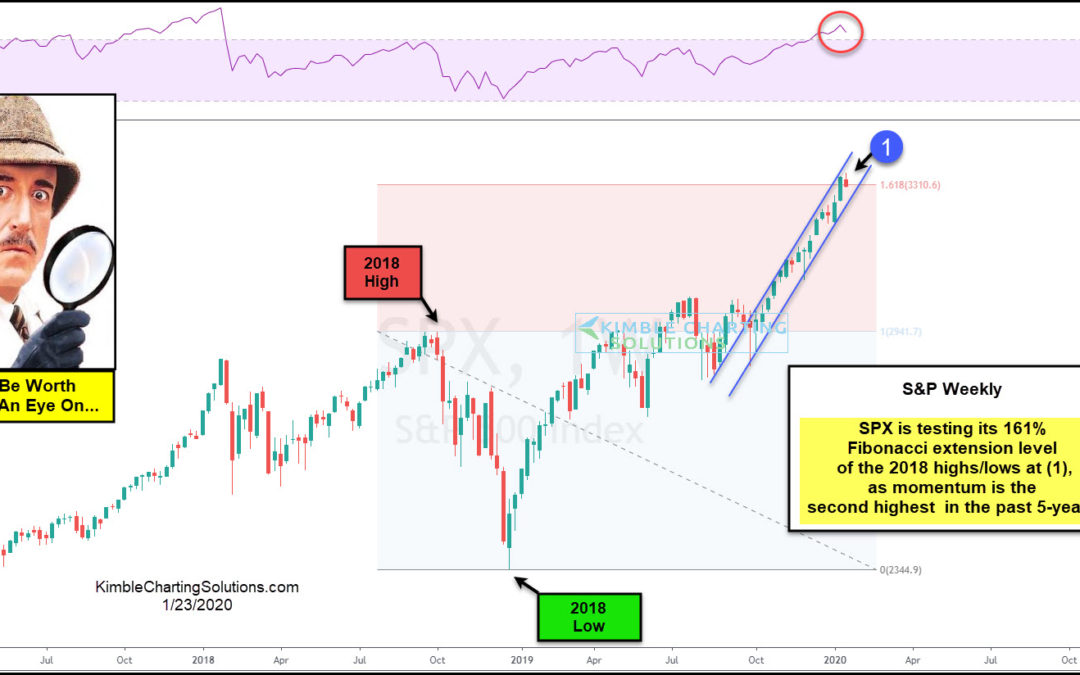
by Chris Kimble | Jan 23, 2020 | Kimble Charting
Some price points lend themselves to potential turning points. Is the S&P at one of those price points? The inspector suggests it is! This chart looks at the S&P 500 over the past couple of years. Fibonacci was applied to the 2018 highs and 2018 lows. The...
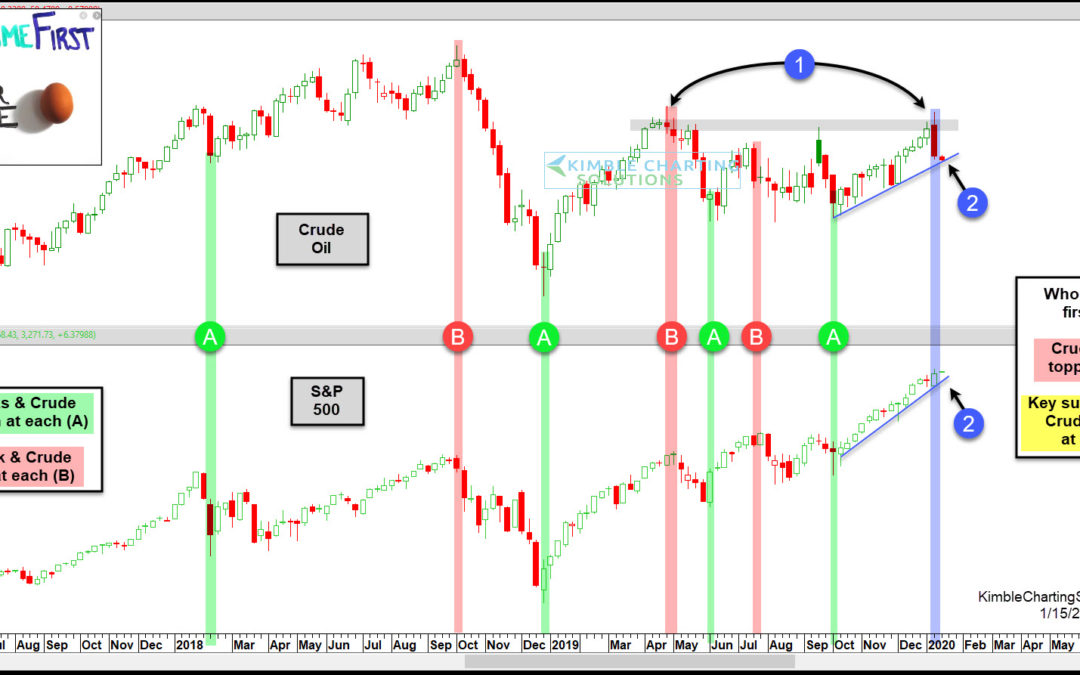
by Chris Kimble | Jan 15, 2020 | Kimble Charting
It’s a good idea for investors to be aware of key indicators and inter-market relationships. Perhaps it’s watching the US Dollar as an indicator for precious metals or emerging markets. Or watching interest rates for the economy. Experience, history, and relationships...

by Chris Kimble | Jan 8, 2020 | Kimble Charting
Crude Oil double topped in late 2018, then it fell nearly 50% in 90-days, taking stocks along with it. Could Crude be “Double Topping” again? Let’s investigate what the chart is showing us. Crude oil created a weekly Doji Star topping pattern at (1)...


