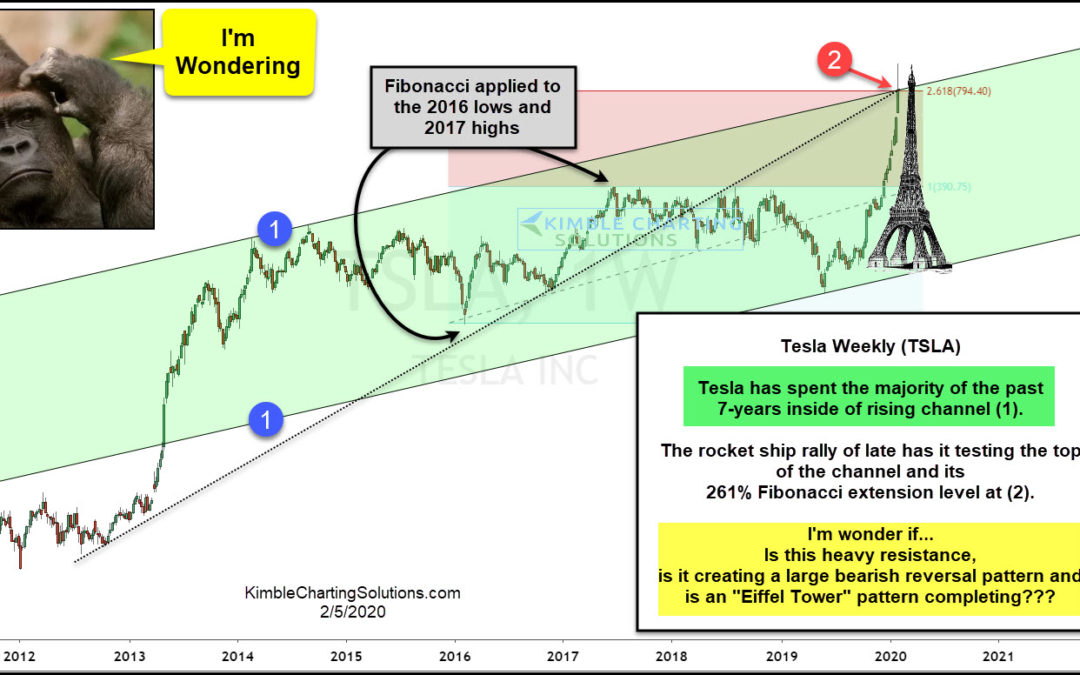
by Chris Kimble | Feb 5, 2020 | Kimble Charting
Tesla have been charging higher since the lows of last May, as it has rallied from $200 a share to nearly $800! Is it about to run out of juice? This chart looks at Tesla (TSLA) over the past 9-years. It has spent the majority of the past 7-years, inside of bullish...
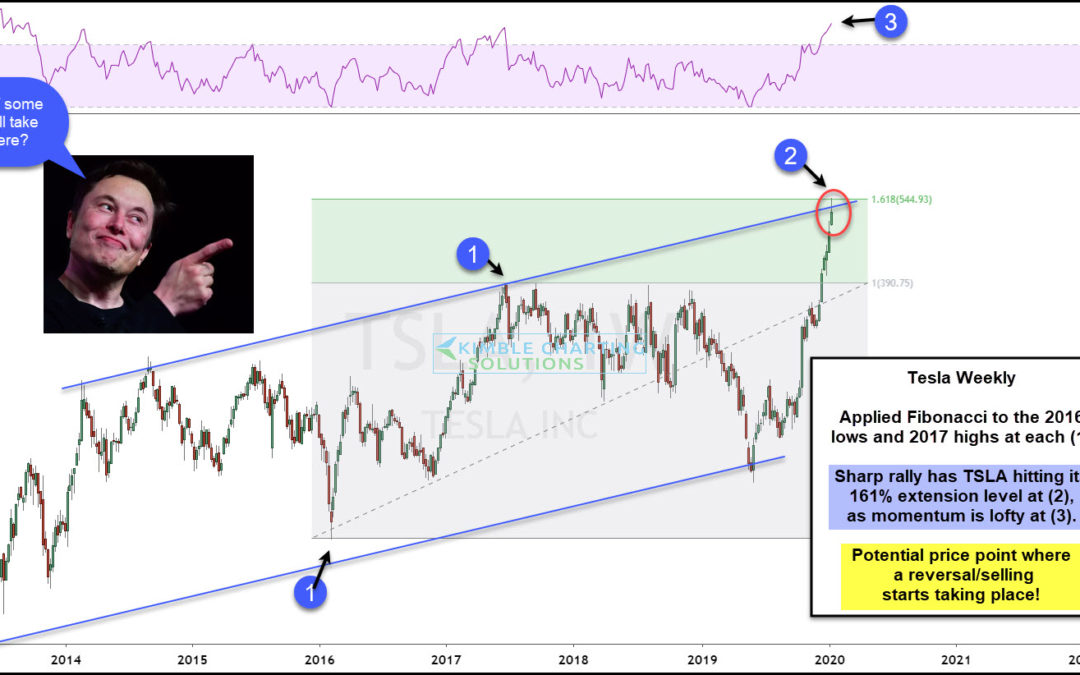
by Chris Kimble | Jan 16, 2020 | Kimble Charting
Tesla (TSLA) has been screaming higher of late, as very impressive gains have taken place. Is Tesla about to run out of energy/take a break/experience some selling pressure? A unique price setup is in play, that bulls might want want to be aware of. This chart applies...

by Chris Kimble | Jul 7, 2017 | Kimble Charting
Tesla has been white hot this year, influencing the Nasdaq and broad markets in a positive way. The rally took Tesla to a key Fibonacci level of late, where it stopped on a dime and headed south fast. Below looks at this key Fibonacci extension level and how it is...

by Chris Kimble | Aug 14, 2015 | Kimble Charting
Let me start off with this…At this time the trend in the tech space is up! The Nasdaq Composite Index and Nasdaq 100 are both above support lines and long-term moving averages! Leading tech indices are at prices points where weakness would not be good to see...

by Chris Kimble | Sep 15, 2014 | Kimble Charting
CLICK ON CHART TO ENLARGE Tesla and Bio Tech have been great performers over the past 24 months. Earlier this year both of them gave back some of there gains and then started another impressive rally. Both are making attempts to make strong closes above highs...
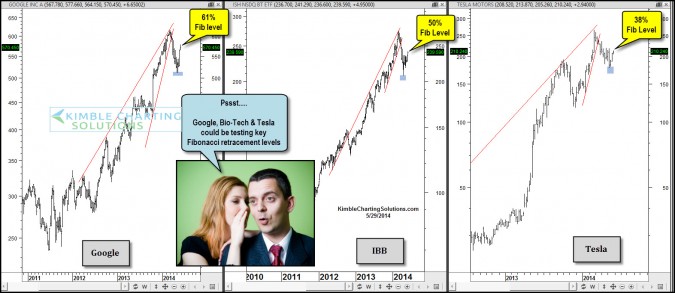
by Chris Kimble | May 29, 2014 | Kimble Charting
CLICK ON CHART TO ENLARGE Almost 90 days ago I shared the 3-pack below, where I inverted Google, Bio-Tech and Tesla, which reflected that each had formed bullish falling wedges. Since the charts were inverted, they were suggesting that each of these three were...

by Chris Kimble | Apr 30, 2014 | Kimble Charting
CLICK ON CHART TO ENLARGE The Power of the Pattern on 3/5 reflected that TSLA, Google & Bio Tech (IBB) were creating bearish rising wedges (see post here) At the time of the post TSLA was trading at $254 per share. The Power...

by Chris Kimble | Mar 28, 2014 | Kimble Charting
CLICK ON CHART TO ENLARGE If I had told you a month ago that Google, Tesla and Bio-Tech would fall -7% to -15% , would you have thought the S&P 500 would be “FLAT” if that happened? Well it did and I suspect that surprised more than...
