
by Chris Kimble | Mar 5, 2014 | Kimble Charting
CLICK ON CHART TO ENLARGE If one believes in buy low and sell higher, do these charts look interesting? The charts above are Google, Bio-tech ETF (IBB) and Tesla inverted. Inverting these chart reflects a different perspective on the strong rallies these three have...
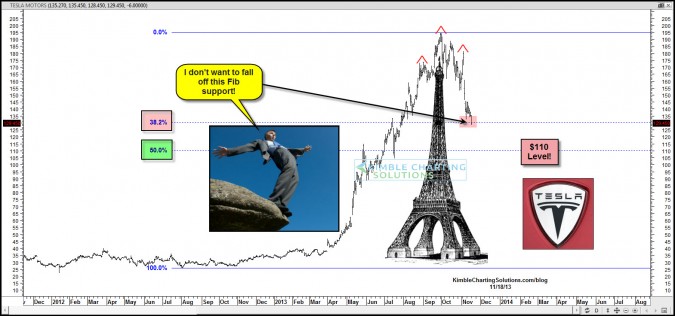
by Chris Kimble | Nov 18, 2013 | Kimble Charting
CLICK ON CHART TO ENLARGE Posted this chart earlier today on stocktwits (see here) reflecting that a break of Fibonacci 38% support could pull $TSLA down to its 50% Fib support at $110. – –
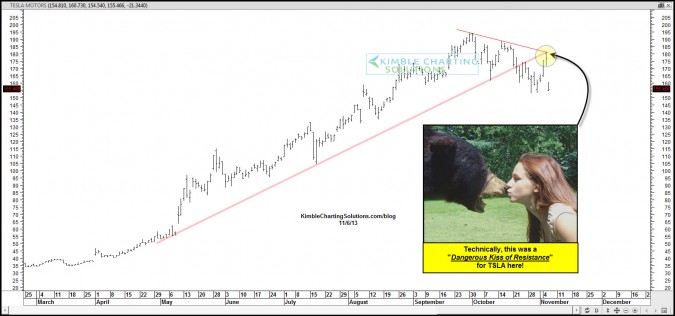
by Chris Kimble | Nov 6, 2013 | Kimble Charting
CLICK ON CHART TO ENLARGE Prior to earnings last night Tesla $TSLA was kissing the underside of two key resistance lines, highlighted in the chart above. This had the potential to be a very “Dangerous Technical Kiss!!!” A month ago I shared that TSLA could...
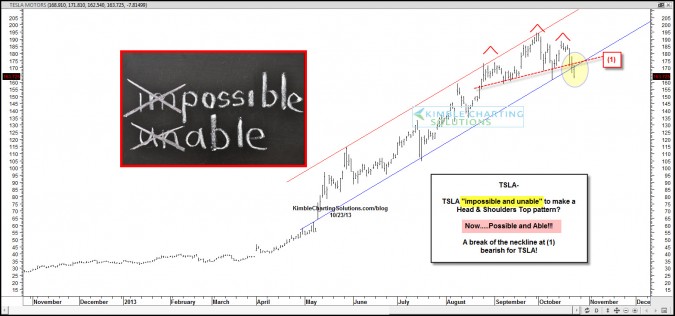
by Chris Kimble | Oct 23, 2013 | Kimble Charting
CLICK ON CHART TO ENLARGE One of the hottest stocks on Wall street could have created a “Head & Shoulders” topping pattern with a break of the neckline taking place today. A bearish pattern, “Head & Shoulders” topping pattern in Tesla...
