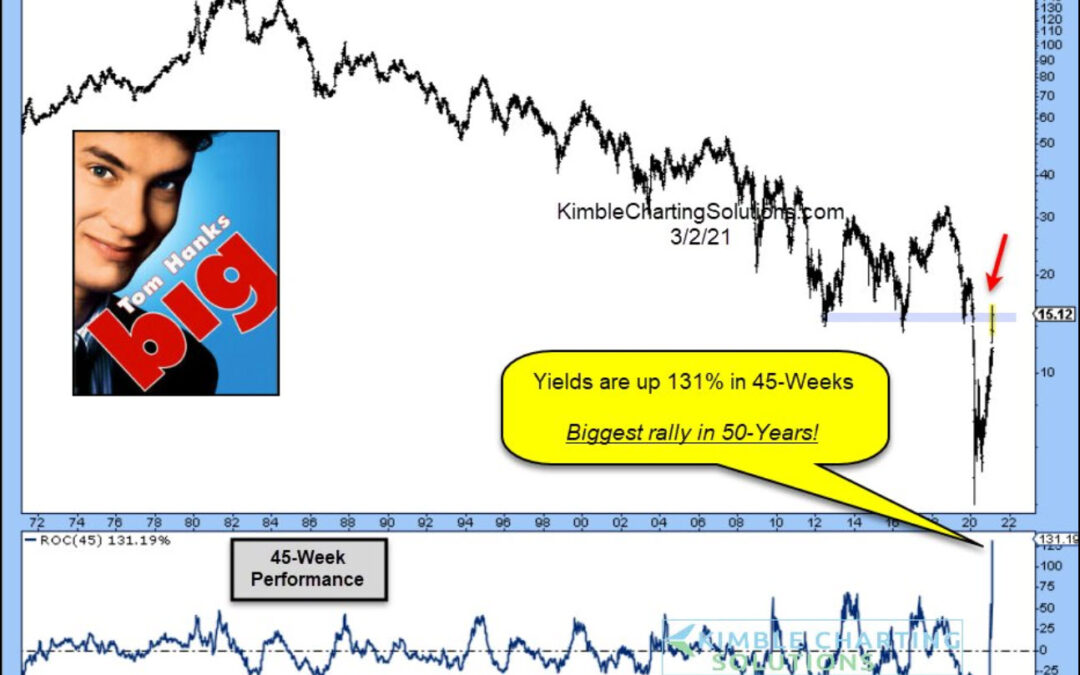
by Chris Kimble | Mar 4, 2021 | Kimble Charting
The waterfall decline of bond yields (and interest rates) has been met with an equally steep rally. In fact, the 10-Year US Treasury bond yield is up 131% in 45 weeks, making it the biggest rally in 50 years! See the chart below. Earlier today we asked if the 40-Year...
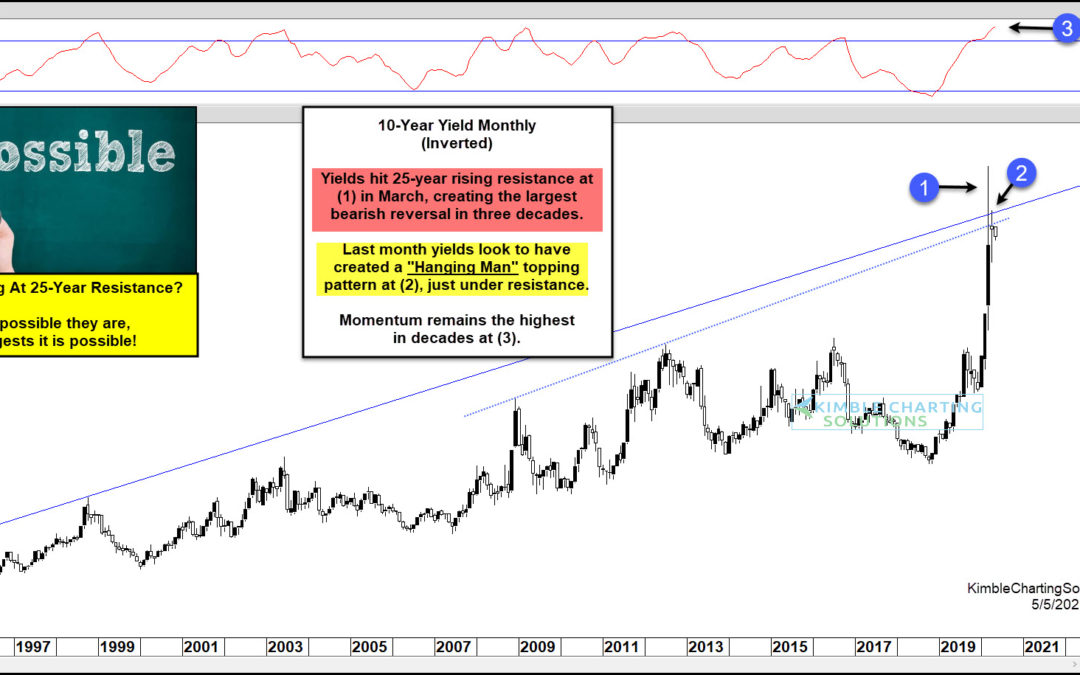
by Chris Kimble | May 6, 2020 | Kimble Charting
If treasury bonds aren’t on your radar, they should be. Many investors and mom and pops own treasury bonds, whether it be a retirement account or pension. Last month, I wrote an article about the potential for a reversal on the 30-Year US Treasury Bond by looking at...

by Chris Kimble | Sep 11, 2019 | Kimble Charting
U.S. Treasury Bond Yields – 2, 5, 10, 30 Year Durations The past year has seen treasury bond yields decline sharply, yet in an orderly fashion. This has spurred recession concerns for much of 2019. Needless to say, it’s a confusing time for investors. In today’s chart...
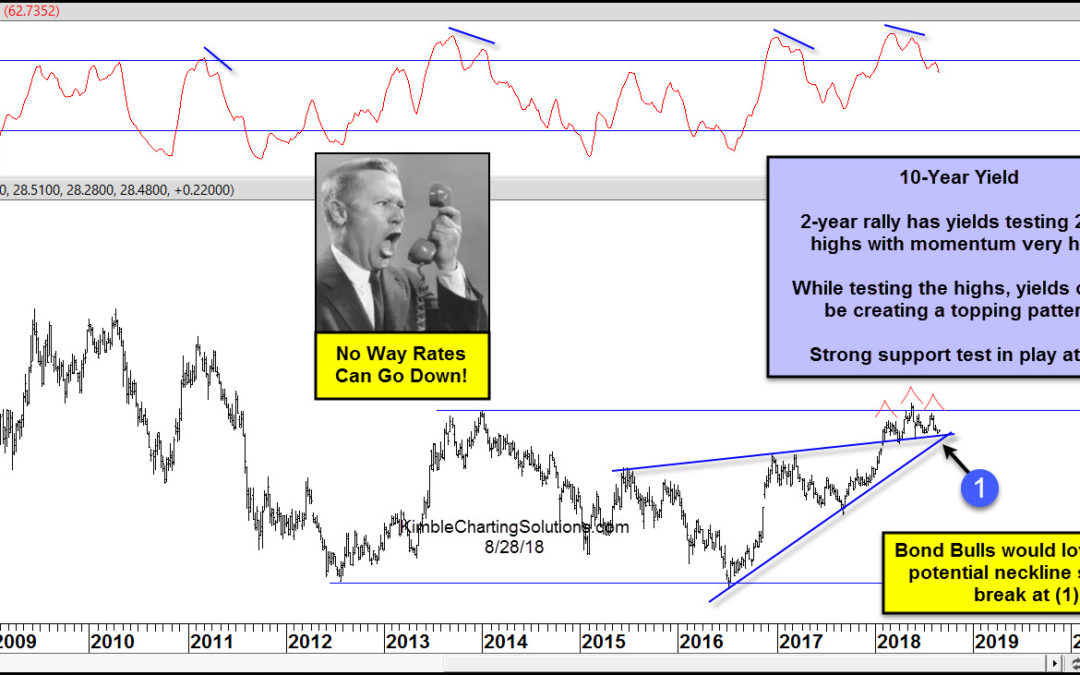
by Chris Kimble | Aug 28, 2018 | Kimble Charting
CLICK ON CHART TO ENLARGE With numerous stock indices hitting all-time highs, is it possible that interest rates could be peaking? It does seem unlikely in my humble opinion. This chart looks at the yield of the 10-year note (TNX), over the past 10-years. The rally...
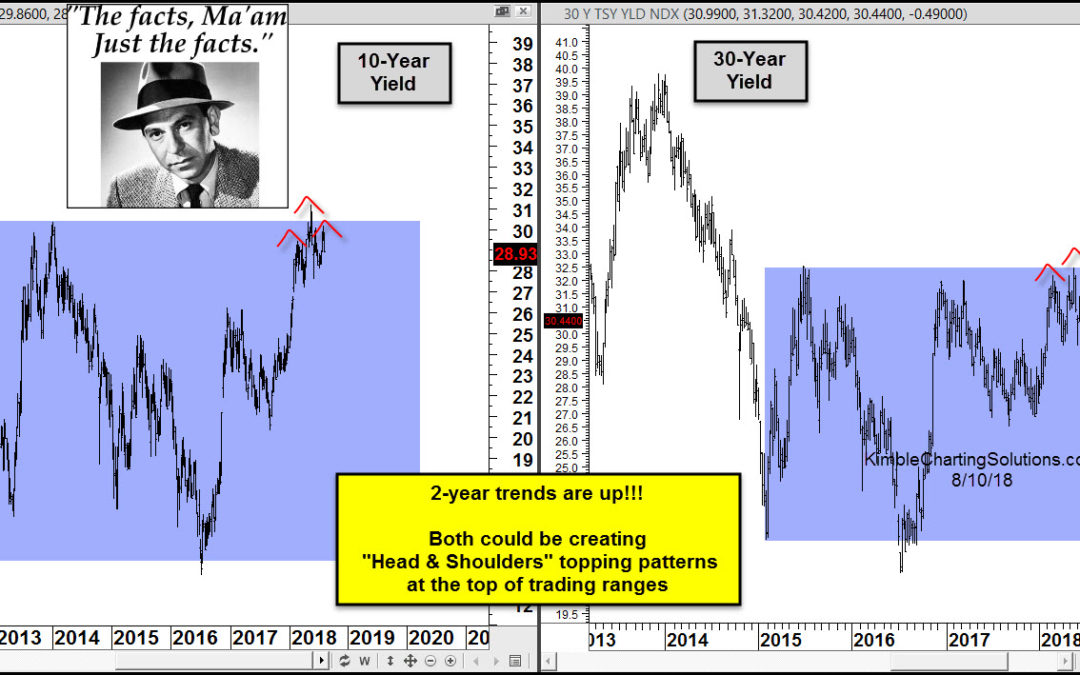
by Chris Kimble | Aug 10, 2018 | Kimble Charting
CLICK ON CHART TO ENLARGE The trend for interest rates over the past couple of years is clearly higher, as yields have risen sharply! The 10-year yield trend over the past 6-years is flat and the same can be said for the 30-year yield over the past 3-years, as each is...
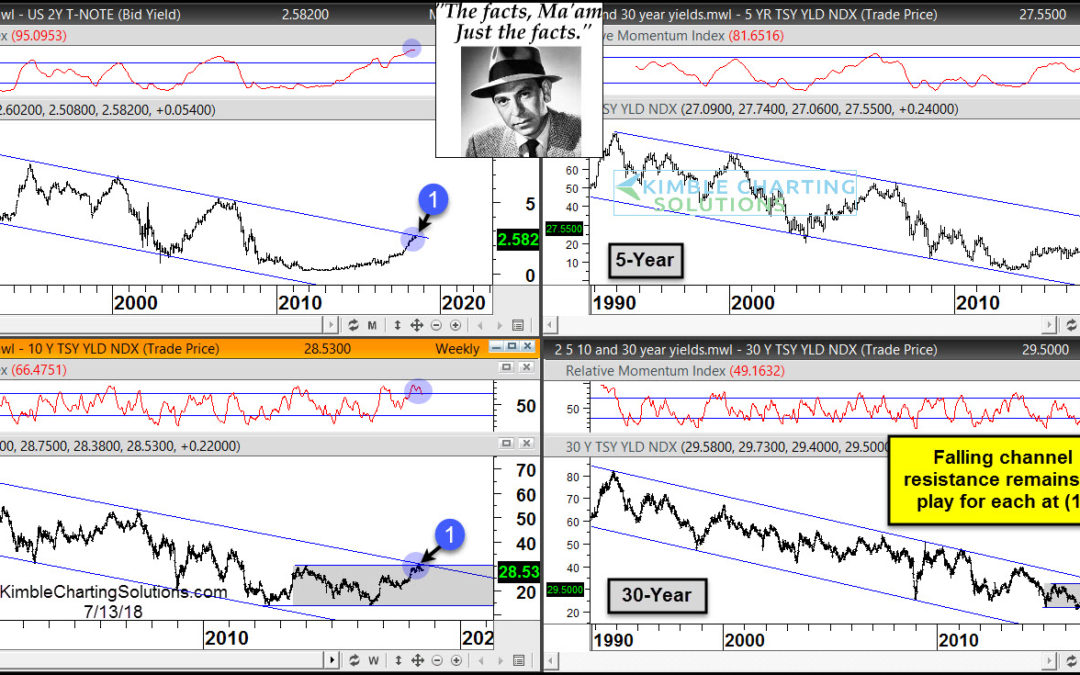
by Chris Kimble | Jul 13, 2018 | Kimble Charting
CLICK ON CHART TO ENLARGE Have interest rates increased over the past couple of years? Yes they have! Have interest rates broken above long-term falling channels? Nope Joe Friday Just The Facts Ma’am- Interest rates (2, 5, 10 & 30-Year yields) are all...
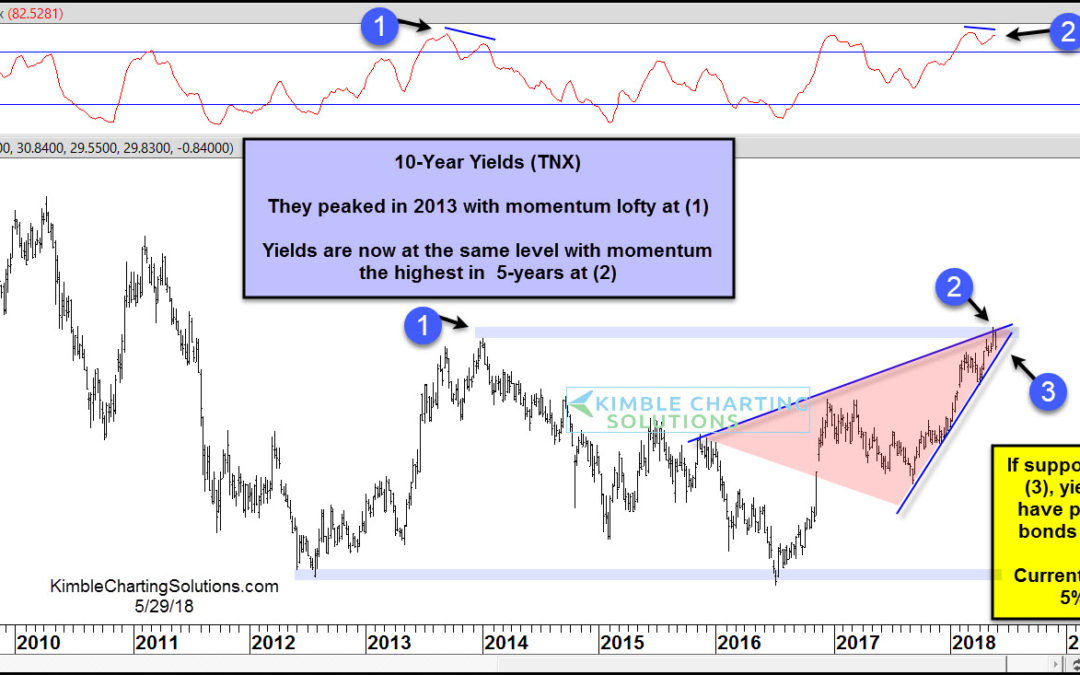
by Chris Kimble | May 29, 2018 | Kimble Charting
CLICK ON CHART TO ENLARGE This chart looks at the Yield on the 10-year note over the past 9-years. A double bottom looks to have taken place as it hit identical lows in 2012 and 2016. Yields have rallied since the lows in 2016 and are now testing the same level where...
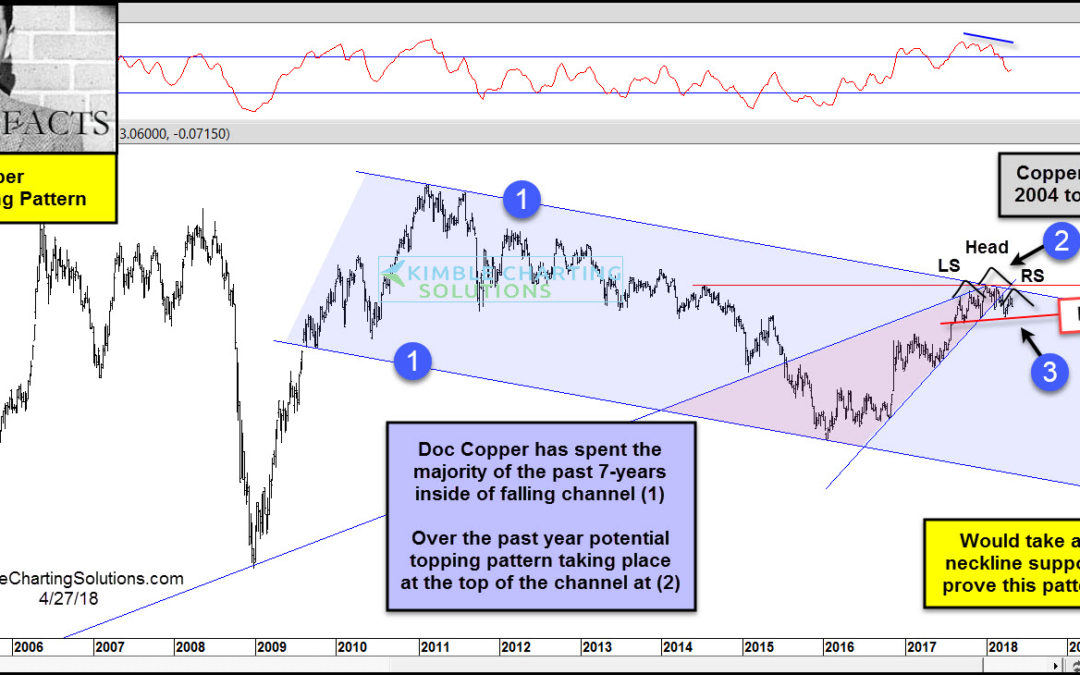
by Chris Kimble | Apr 27, 2018 | Kimble Charting
CLICK ON CHART TO ENLARGE The long-term trend of Doc Copper remains down, as it has created a series of lower highs and lower lows inside of falling channel (1) over the past 7-years. It hit the bottom of the channel in late 2015, where it found support and a rally...
