by Chris Kimble | Apr 24, 2018 | Kimble Charting
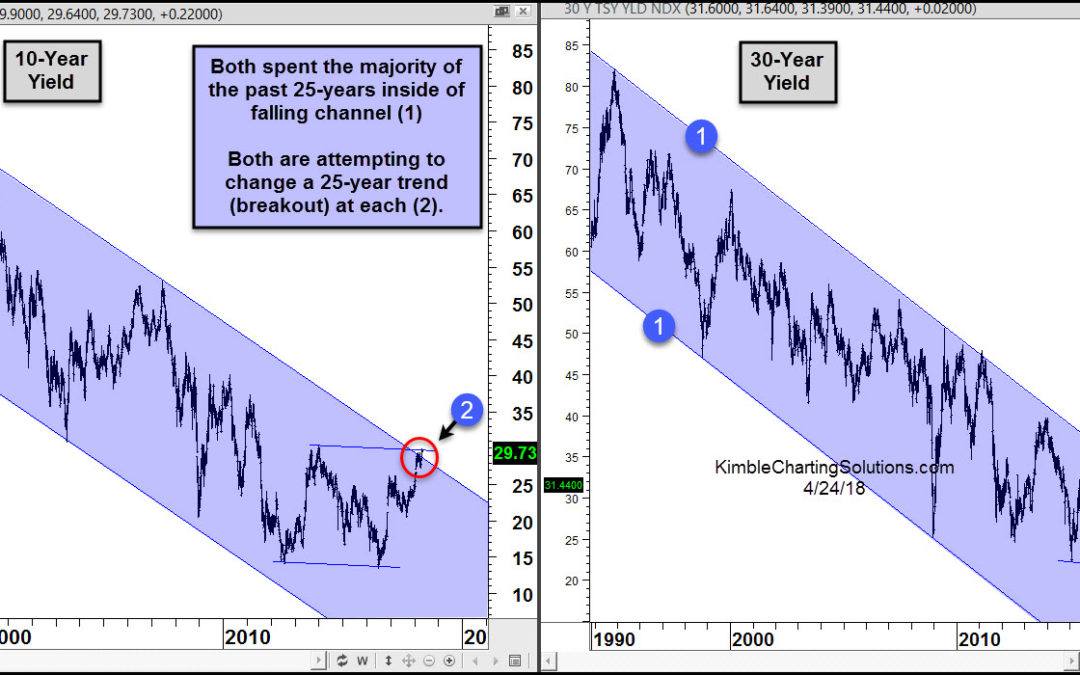
CLICK ON CHART TO ENLARGE Interest rates have been falling for nearly three decades. Could the trend of lower rates be over? A big test to this trend is in play right now! Above looks at 10 & 30-year yields since early 1990’s. Both have remained inside of...
by Chris Kimble | Feb 26, 2018 | Kimble Charting
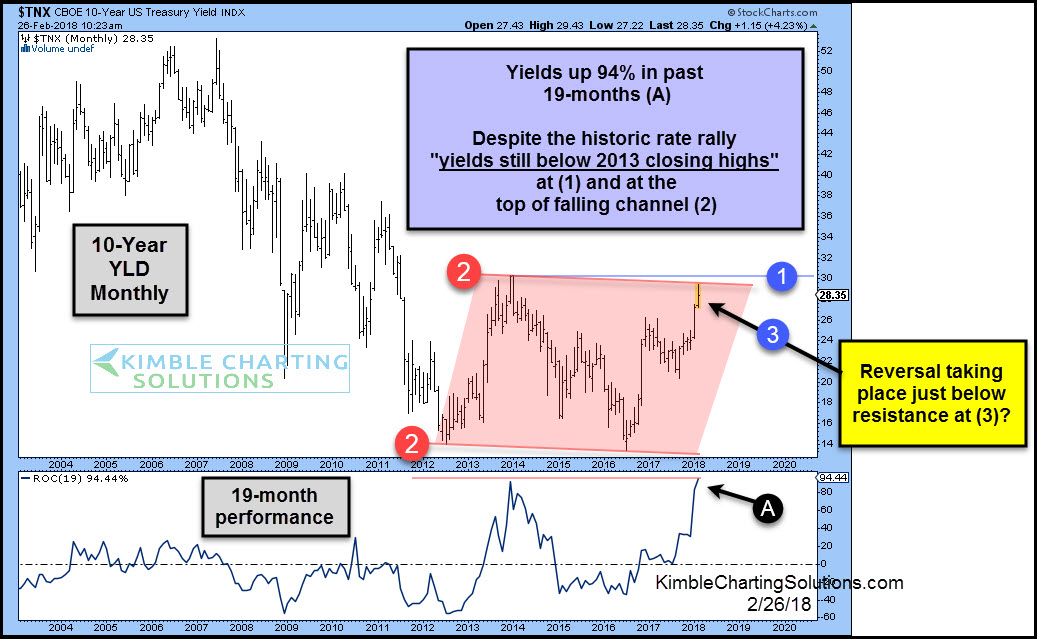
CLICK ON CHART TO ENLARGE The top part of the chart above looks at the 10-year yield on a monthly basis going back 14-years. The bottom section looks at the 19-month performance since 2004. Yields are up 94% in the past 19-months, which is the largest 19-month rally...

by Chris Kimble | Oct 25, 2017 | Kimble Charting
Interest rates based upon the 10-year yield (TNX) have been heading lower for years, more than 25-years actually. Below looks at the yield on the 10-year note and reflects that an important and rare test is in play. CLICK ON CHART TO ENLARGE Yields on the 10-year note...
