by Chris Kimble | Jan 18, 2011 | Kimble Charting
Last week I shared that the Dollar looked to be trapped inside of a trading range and should start to move lower due to key resistance. See chart below (see post here) This situation suggested that so called “risk trade” positions could do well....

by Chris Kimble | Jan 12, 2011 | Kimble Charting
Yesterday I suggested to pick up EEM (see post here) due to the situation in the U.S. Dollar. Was looking for “relative outperformance” by owning this position. CLICK ON CHART TO ENLARGE As I shared in the chart above, the ascending triangle...

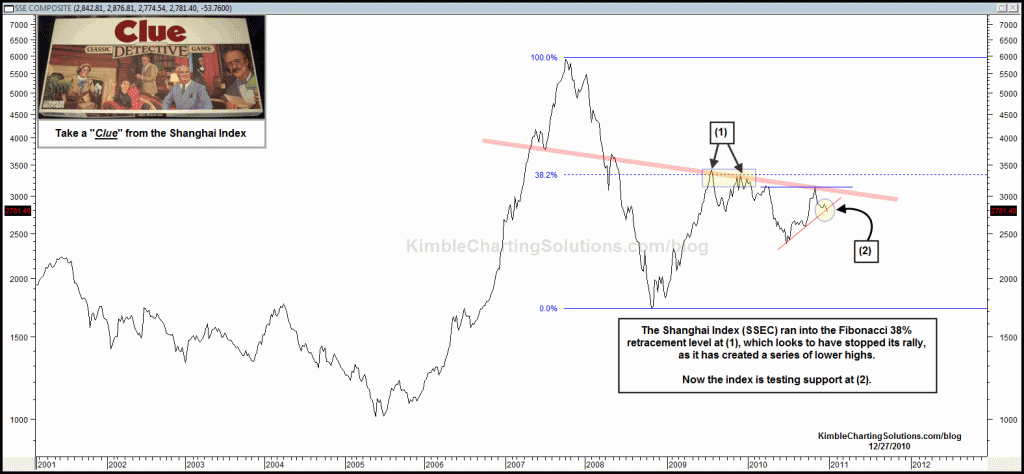
by Chris Kimble | Dec 27, 2010 | Kimble Charting
CLICK ON CHART TO ENLARGE Last week in the post “Cracks in the Great Wall” (see post here) I highlighted that the China ETF (FXI) was breaking support. Now the Shanghai index looks to be attempting to break key support at (2) in the chart above. ...

by Chris Kimble | Oct 22, 2010 | Kimble Charting
Emerging markets, especially some of the smaller countries have been “HOT PERFORMERS” over the last 6 months, as the U.S. Dollar has declined over 15% since it peaked in June. See performace below, compared to the 500 index! CLICK ON CHART TO...


