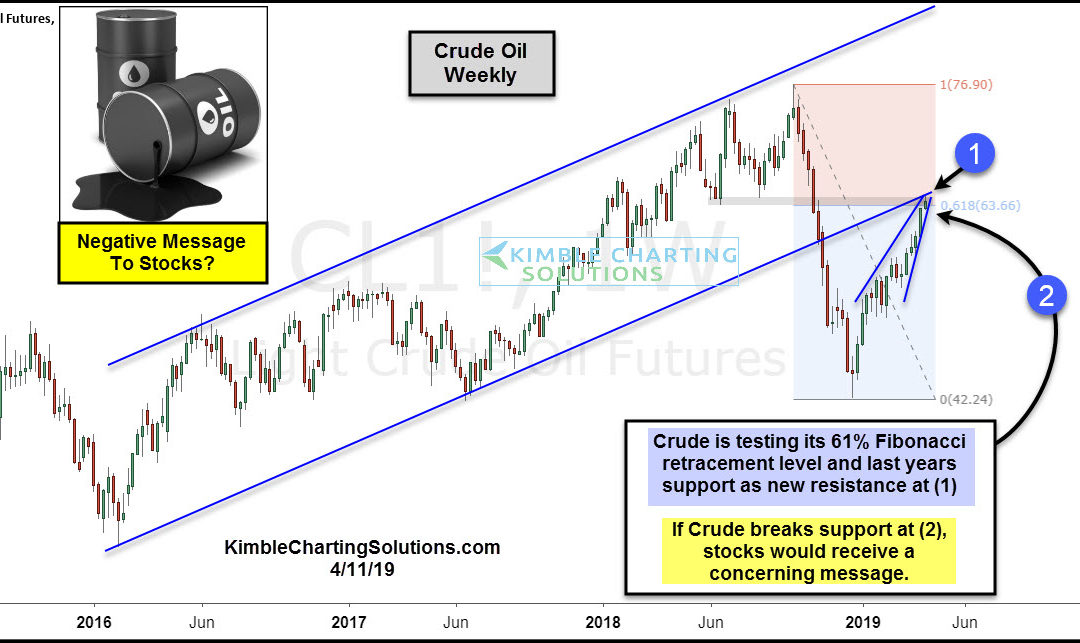
by Chris Kimble | Apr 11, 2019 | Kimble Charting
Crude Oil and the S&P 500 peaked together in September of last year and both bottomed together this past December. Is Crude Oil about to peak and send a bearish message to stocks? A resistance test is in play that could well answer this question. The rally by...
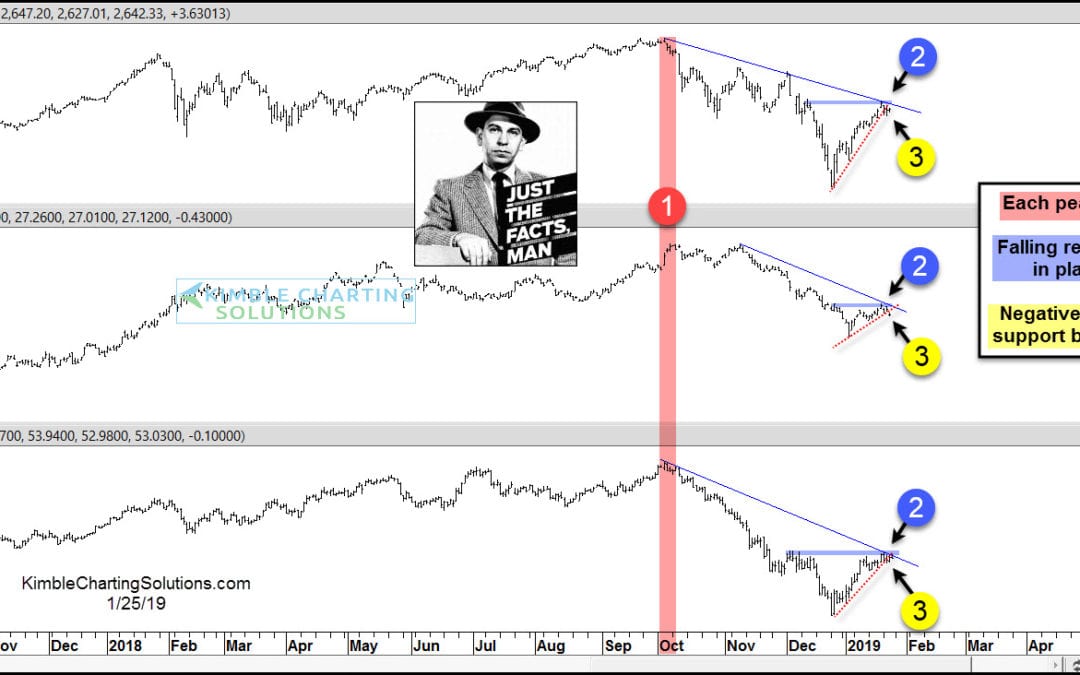
by Chris Kimble | Jan 25, 2019 | Kimble Charting
Stocks, Yields and Crude Oil have experienced a high degree of correlation since the October highs and each looks to be experiencing a key price test at the same time! The S&P 500, 10-year yields and Crude Oil hit highs at nearly the same time in early October at...
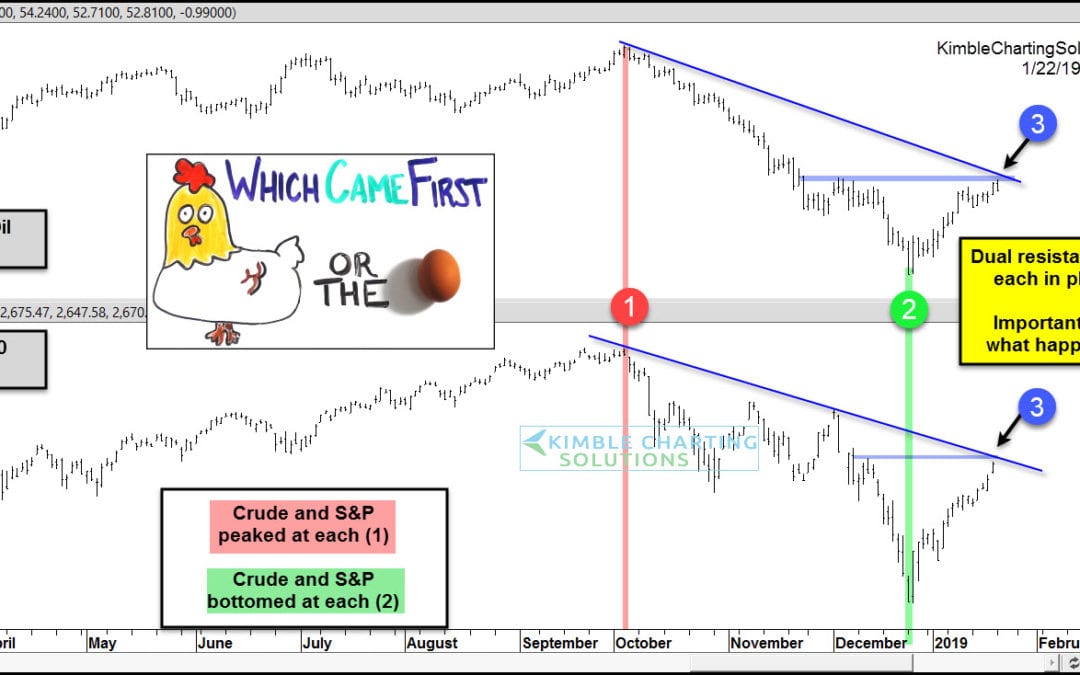
by Chris Kimble | Jan 22, 2019 | Kimble Charting
The correlation between Crude Oil and the S&P 500 has been rather high over the last 100-days, as each looks to have peaked at the same time around the 1st of October at (1). After peaking together in October, Crude fell over 40% and the S&P nearly declined...
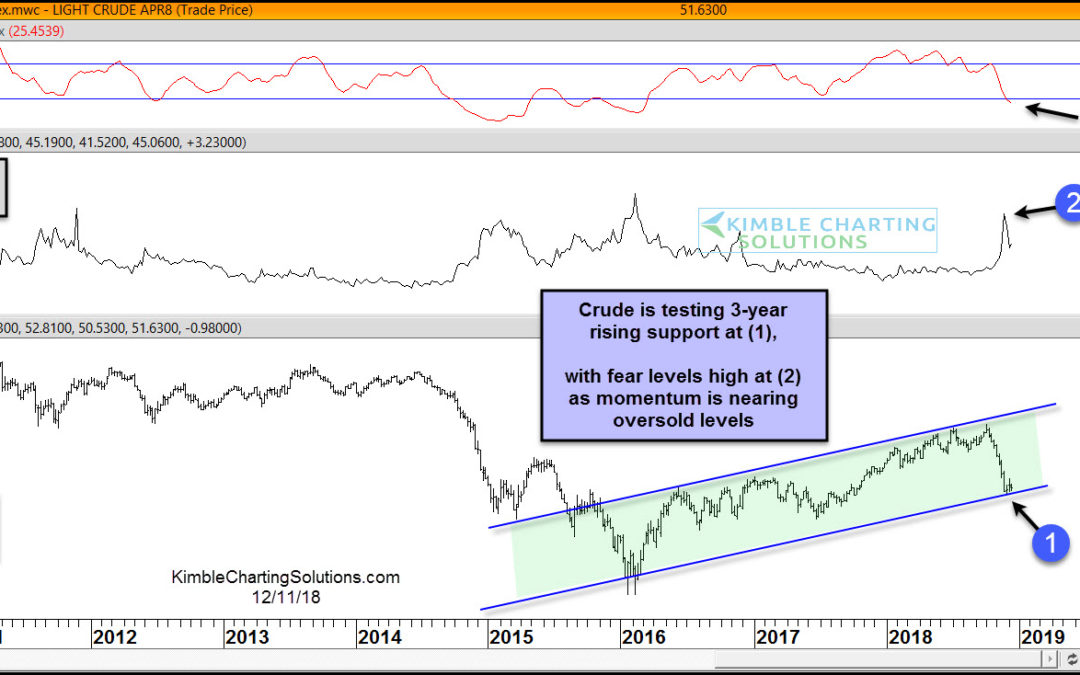
by Chris Kimble | Dec 11, 2018 | Kimble Charting
Crude oil has been hit hard of late. The decline has Crude testing 3-year rising support at (1), as fear levels are high at (2) and weekly momentum is currently nearing oversold levels. Below looks at Crude Oil and its 10-week performance – Crude Oil has...
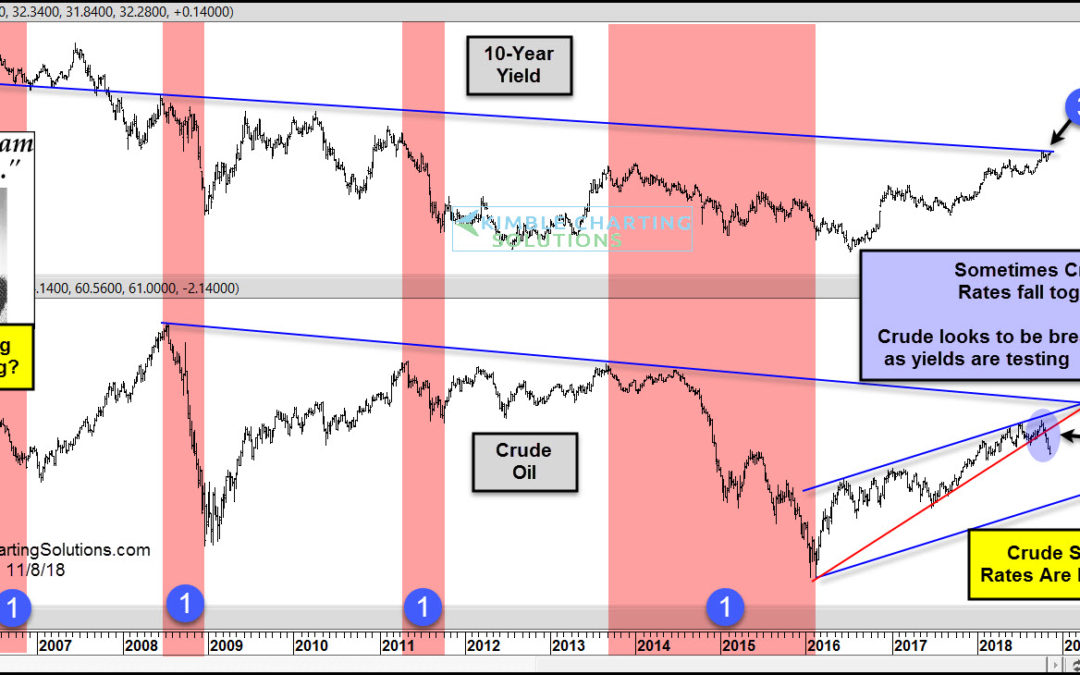
by Chris Kimble | Nov 9, 2018 | Kimble Charting
CLICK ON CHART TO ENLARGE Joe Friday suggested that Crude Oil could be peaking in the chart above first shared on 5/25/18, as Crude was testing its 50% retracement level at (2). Weakness in Crude of late has it down near 20% from recent highs. Crude is one of the...
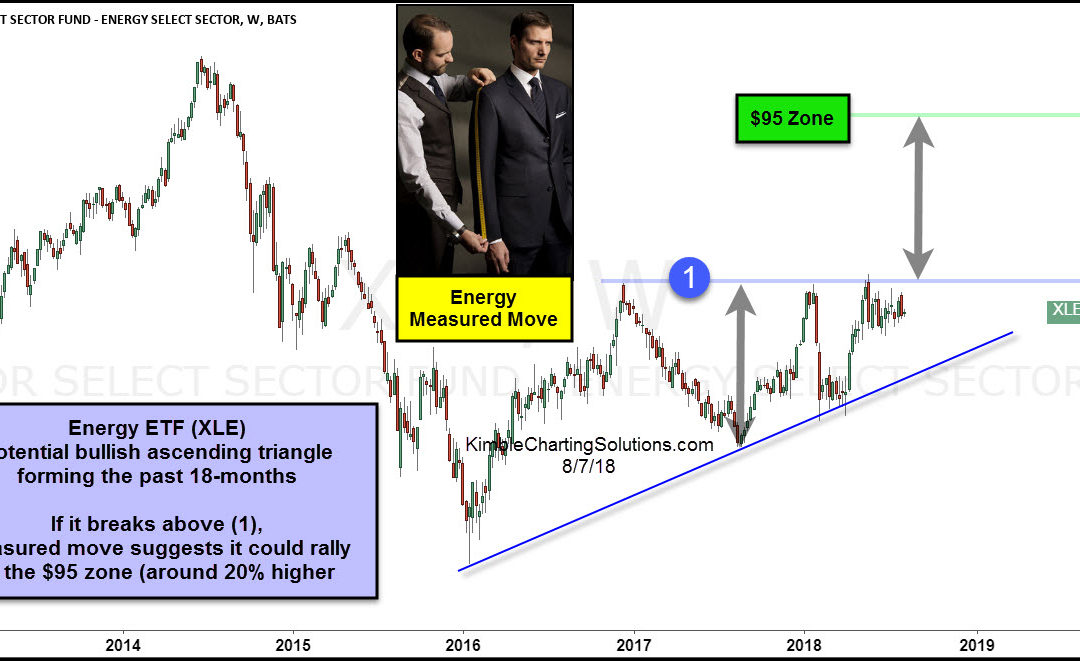
by Chris Kimble | Aug 7, 2018 | Kimble Charting
CLICK ON CHART TO ENLARGE Energy ETF (XLE) has struggled to get above the $80 level while creating a series of higher lows over the past 18-months. This price action could be creating a bullish ascending triangle pattern. The top of the pattern comes into play at the...
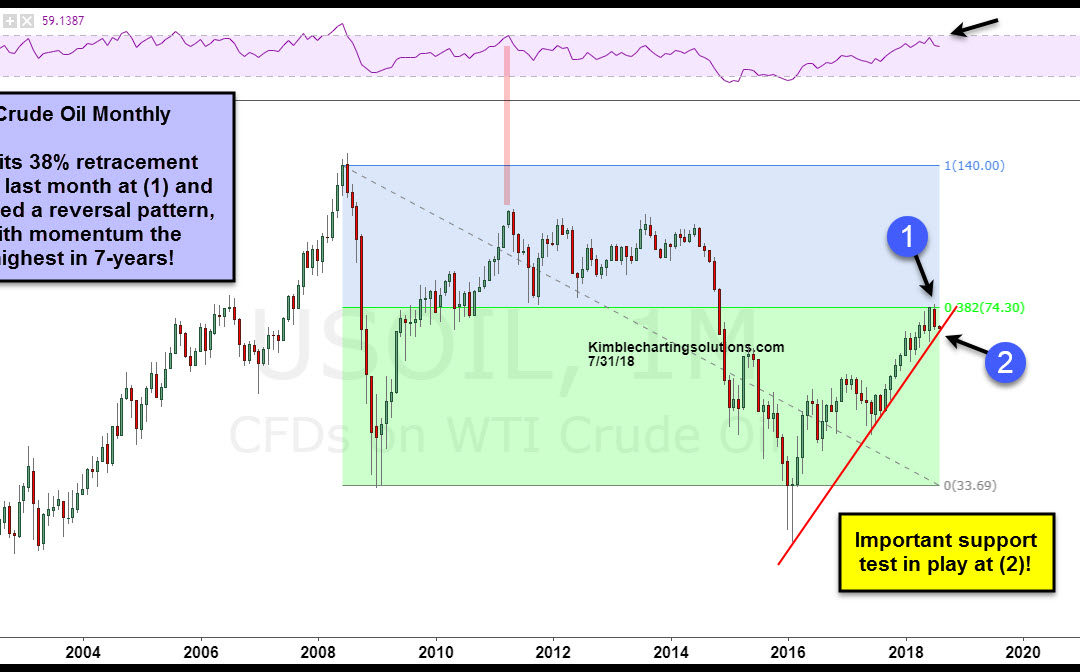
by Chris Kimble | Aug 1, 2018 | Kimble Charting
CLICK ON CHART TO ENLARGE This chart looks at Monthly Crude Oil Futures over the past 16-years, with Fibonacci retracement levels applied to the monthly “closing highs in 2008 and the closing lows of 2016.” The rally over the past couple of years took it...
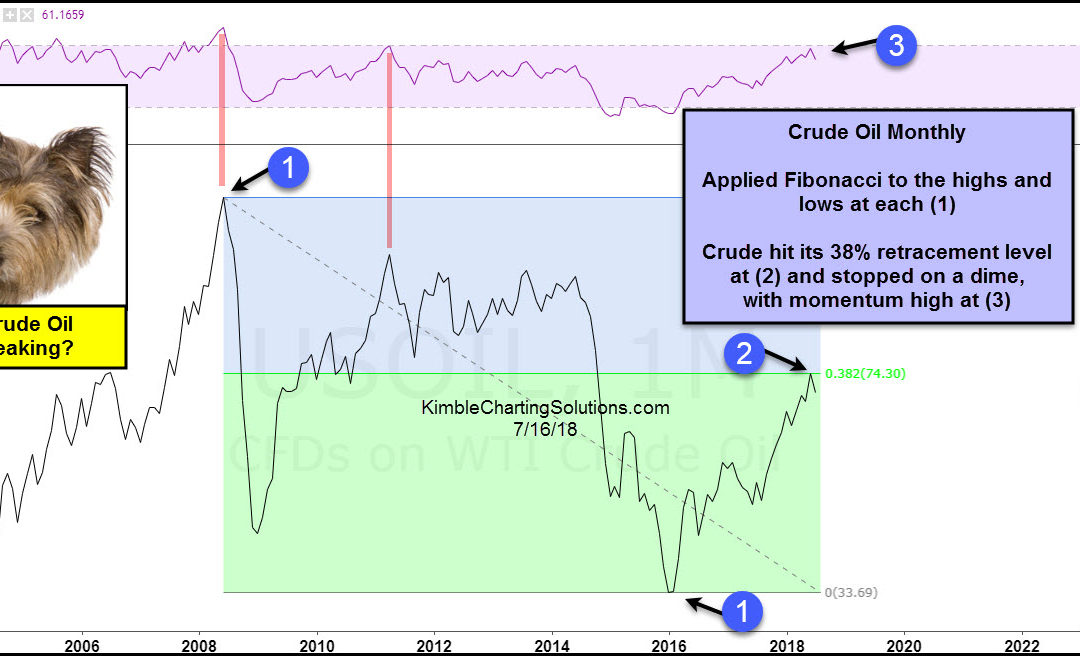
by Chris Kimble | Jul 16, 2018 | Kimble Charting
CLICK ON CHART TO ENLARGE The chart above looks at what could be the most important commodity on the planet, Crude Oil and its price action over the past 15-years. We applied Fibonacci retracement levels to the highs in 2008 and the lows in 2016, at each (1). The...
