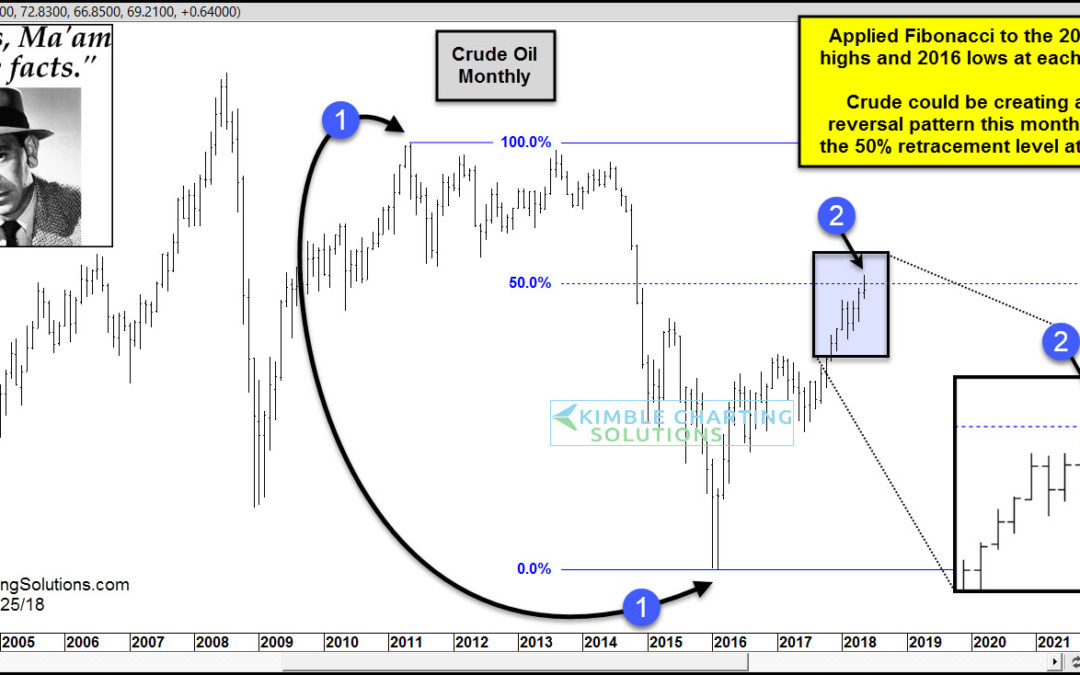
by Chris Kimble | May 25, 2018 | Kimble Charting
CLICK ON CHART TO ENLARGE This chart looks at Crude Oil on a monthly basis over the past 15-years. Crude experienced a large decline (75%+) from the highs in 2011 to the lows in 2016. We applied Fibonacci to this key highs and lows at each (1) above. The rally from...
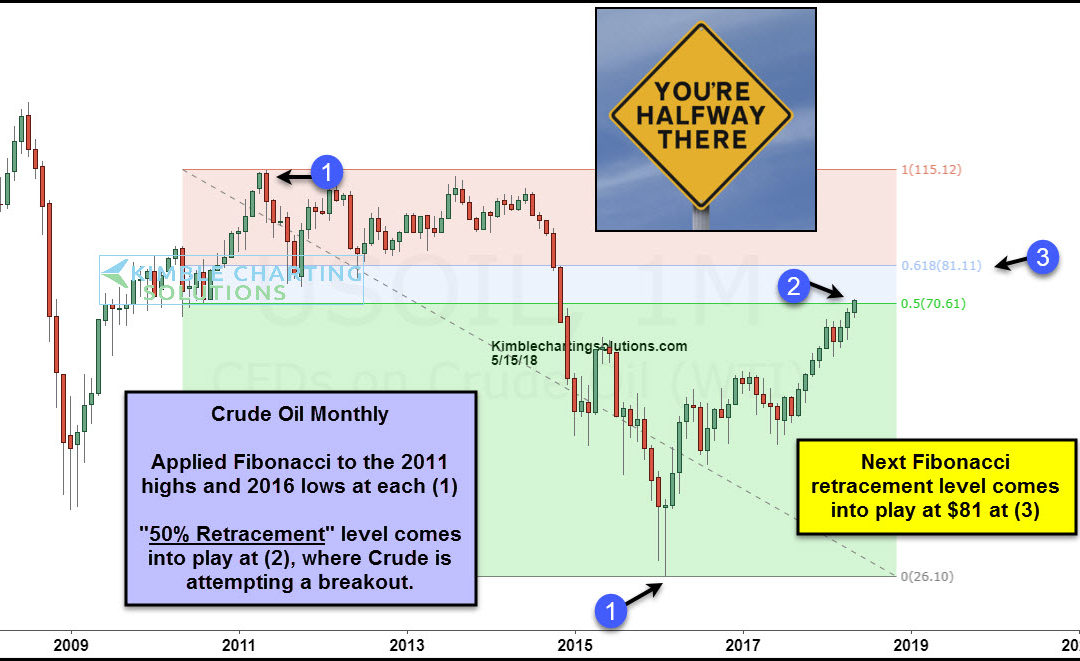
by Chris Kimble | May 15, 2018 | Kimble Charting
CLICK ON CHART TO ENLARGE This chart looks at Crude Oil on a monthly basis over the past decade. We applied Fibonacci retracement levels to the highs in 2011 and the lows in 2016 at each (1). The rally of late has Crude attempting to break out above the 50%...
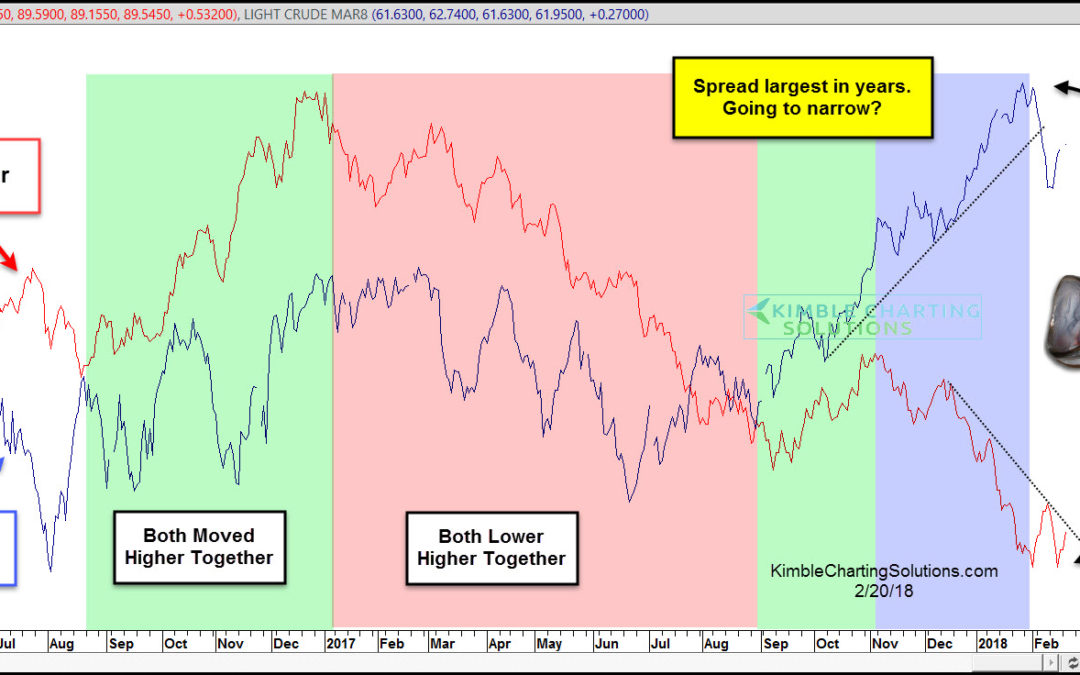
by Chris Kimble | Feb 20, 2018 | Kimble Charting
CLICK ON CHART TO ENLARGE King Dollar & Crude Oil sometimes dance to the same tune (correlate) and sometimes they head in opposite directions (non-correlate). Above looks at the correlation between the two over the past couple of years. From September of 2016...
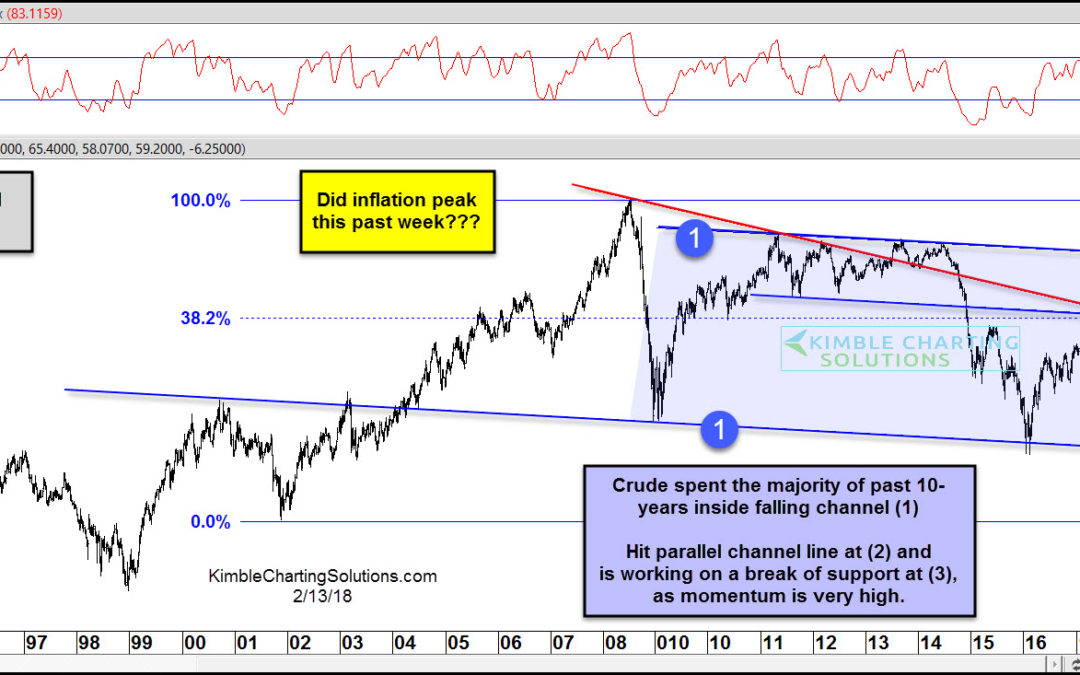
by Chris Kimble | Feb 13, 2018 | Kimble Charting
I shared the chart below on Crude Oil in my Coffee with Chris email to members Saturday morning. This chart looks at Crude Oil over the past 20-years and highlights a triple test of resistance is in play along with a crowded trade. CLICK ON CHART TO ENLARGE Crude hit...
by Chris Kimble | Nov 27, 2017 | Kimble Charting
The last 5-months Crude Oil has experienced a strong rally and has been much stronger than the S&P 500 (gained 27% more), highlighted in the chart below- CLICK ON CHART TO ENLARGE This strong rally now has Crude testing what could be an important price zone for...

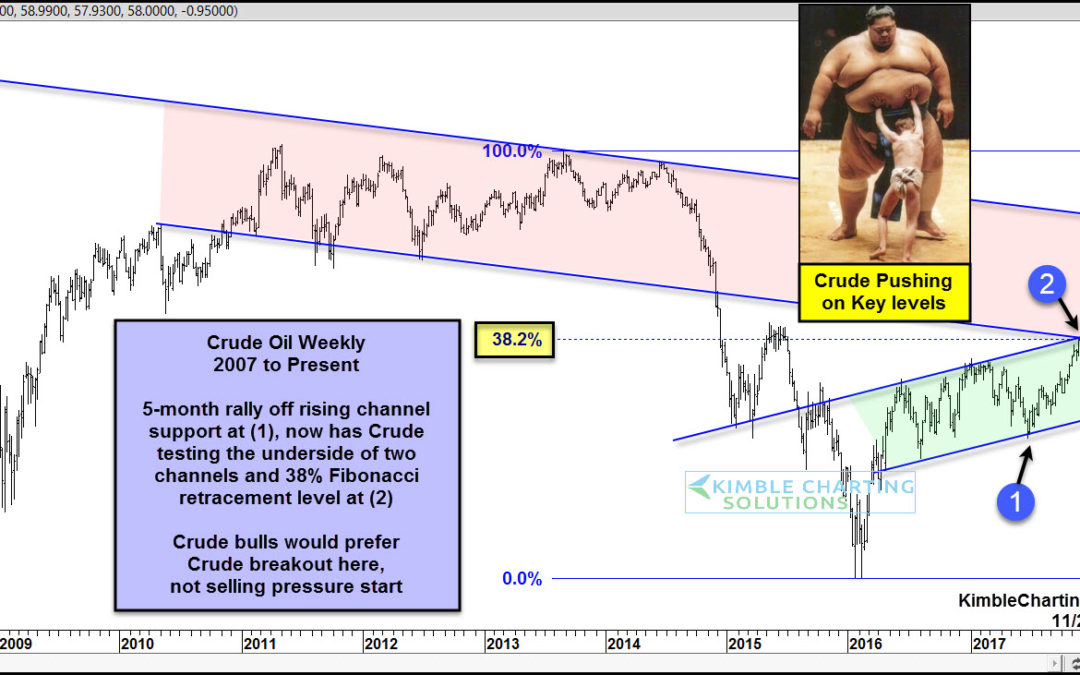
by Chris Kimble | Nov 7, 2017 | Kimble Charting
Crude Oil has been strong of late. Did you realize that Crude Oil has gained more in the past month than the S&P 500 has this year, see chart below. CLICK ON CHART TO ENLARGE The strong rally of late has Crude testing what appears to be a very important level in...

by Chris Kimble | Oct 31, 2017 | Kimble Charting
Crude Oil has been moving higher of late, putting it at a price point that looks to be important from a long-term perspective. Below looks at Crude Oil over the past 10-years and how it is facing a key breakout test on Halloween- CLICK ON CHART TO ENLARGE As mentioned...

by Chris Kimble | Oct 13, 2017 | Kimble Charting
Just The Facts- Energy ETF (XLE) has lagged the S&P 500 by a large margin over the past three years, reflected in the chart below- CLICK ON CHART TO ENLARGE The chart above reflects that XLE has underperformed the S&P 500 by nearly 60% over the past three...
