by Chris Kimble | Nov 26, 2014 | Kimble Charting
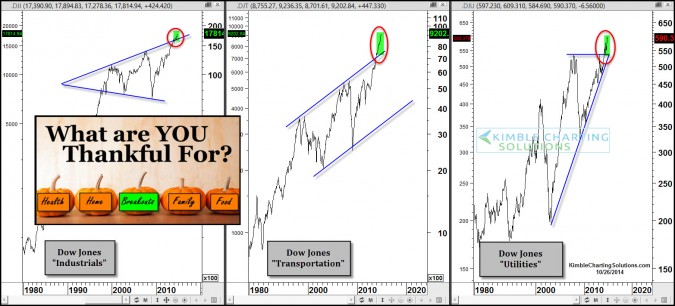
CLICK ON CHART TO ENLARGE What are you “Thankful For?” This is a great time of year to count our blessings and become more aware of things we should be Thankful For. I am Thankful for many things, too many to list and bore you...

by Chris Kimble | Nov 3, 2014 | Kimble Charting
CLICK ON CHART TO ENLARGE Definition of Dow Theory – A theory which says the market is in an upward trend if one of its averages (industrial or transportation) advances above a previous important high, it is accompanied or followed by a similar...
by Chris Kimble | Aug 4, 2014 | Kimble Charting
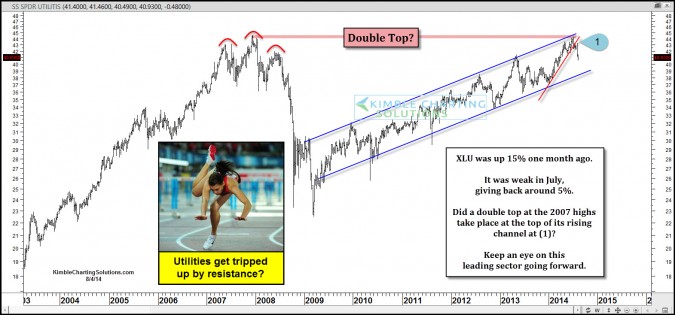
CLICK ON CHART TO ENLARGE A month ago Utilities ETF (XLU) was up almost 15%, making it one of the best performing sectors year to date. The strong rally over the past 8 months took XLU to the top of its rising trend channel and back to the highs reached...

by Chris Kimble | Aug 4, 2014 | Kimble Charting
Dow Theory says the market is in an upward trend if one of its averages (industrial or transportation) advances above a previous important high and it is accompanied or followed by a similar advance in the other. The theory also says that when both...
by Chris Kimble | May 2, 2014 | Kimble Charting
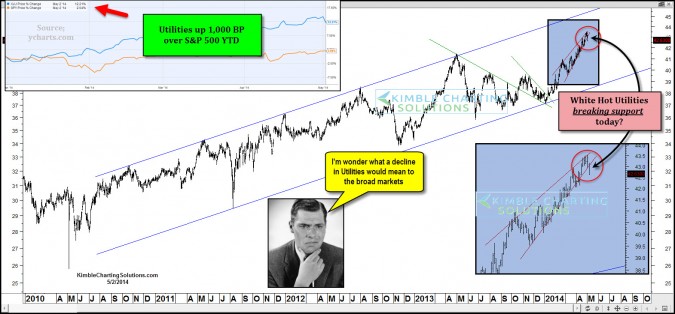
CLICK ON CHART TO ENLARGE Defensive sector utilities could be breaking support today. This sector is up over 1,000 basis points (10%) more than S&P 500 this year. I’m honestly not sure what the message is here! It sure does have my attention...

by Chris Kimble | Jan 8, 2014 | Global Dashboard, Kimble Charting
The Power of the Pattern suggested interest rates were about to blast off in May of last year (See post here) Since that post the yield on the 10-year note is up 80%! Below is the performance of interest sensitive assets & the S&P 500 since that...
by Chris Kimble | May 29, 2013 | Kimble Charting
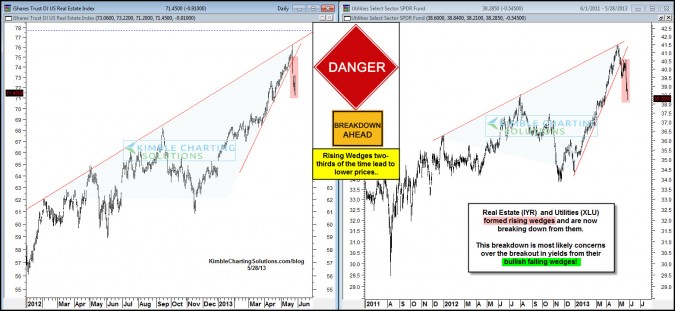
CLICK ON CHART TO ENLARGE These high flying yield plays formed bearish rising wedge, which two-thirds of the time suggest lower prices are ahead. Reit ETF (IYR) and Utilities ETF (XLU) are breaking down from these bearish patterns. ...

by Chris Kimble | May 10, 2013 | Kimble Charting
CLICK ON CHART TO ENLARGE Earlier this week the Power of the Pattern shared that Utilities had almost doubled the performance of the S&P 500 and they were making a bearish rising wedge up against a trio of resistance. Reflecting that Utilities could run out of...
