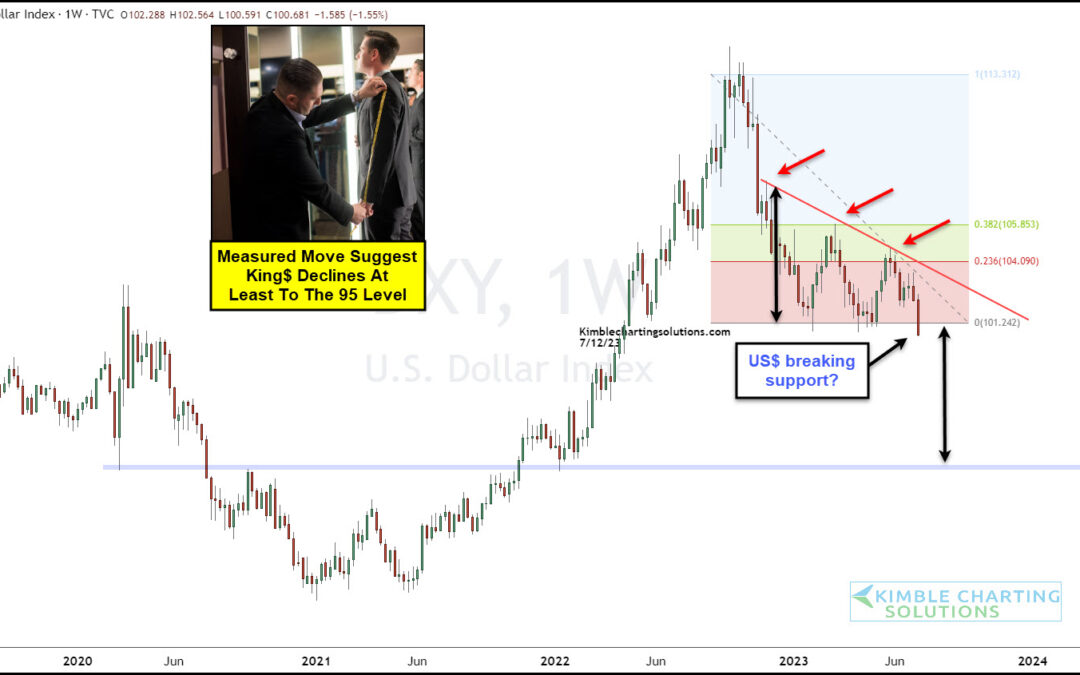
by Chris Kimble | Jul 14, 2023 | Kimble Charting
After peaking in 2022, the US Dollar Index has spent nearly a year in decline. But it may be set to fall even further. And any further weakness in King Dollar will be bullish for precious metals like Gold and Silver. Today’s chart looks at the US Dollar Index on a...
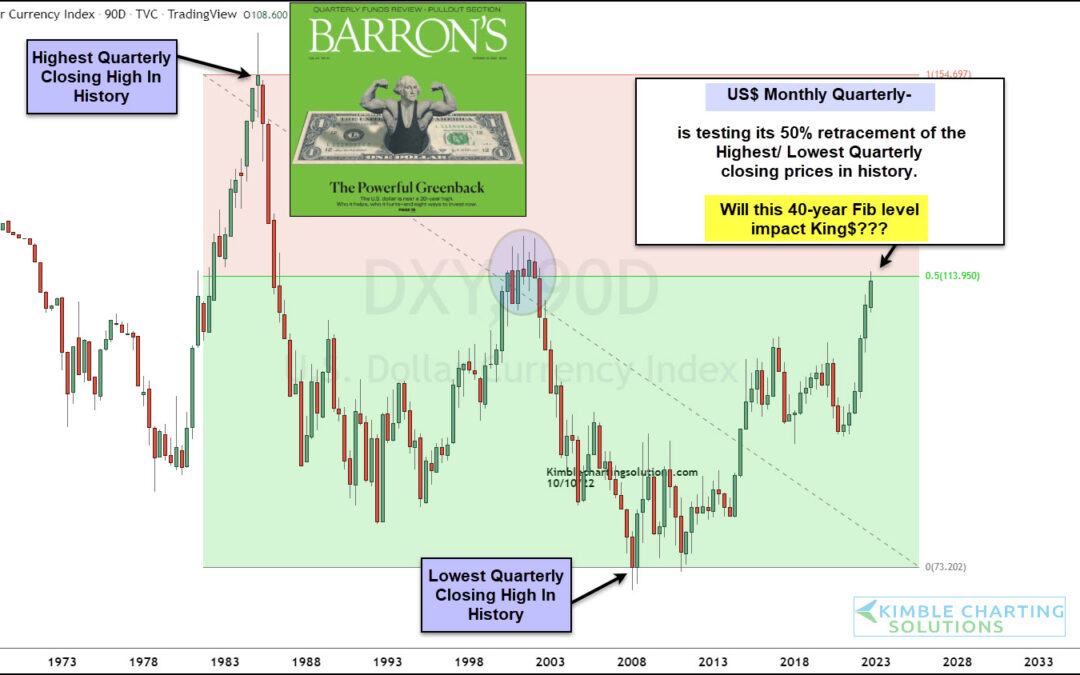
by Chris Kimble | Oct 11, 2022 | Kimble Charting
The US Dollar Index has propelled higher out of a double bottom formation that began in 2008… and nothing has slowed down King Dollar for nearly 14 years. The latest show of strength in the US Dollar has the financial markets on edge. After all, the Forex is the...
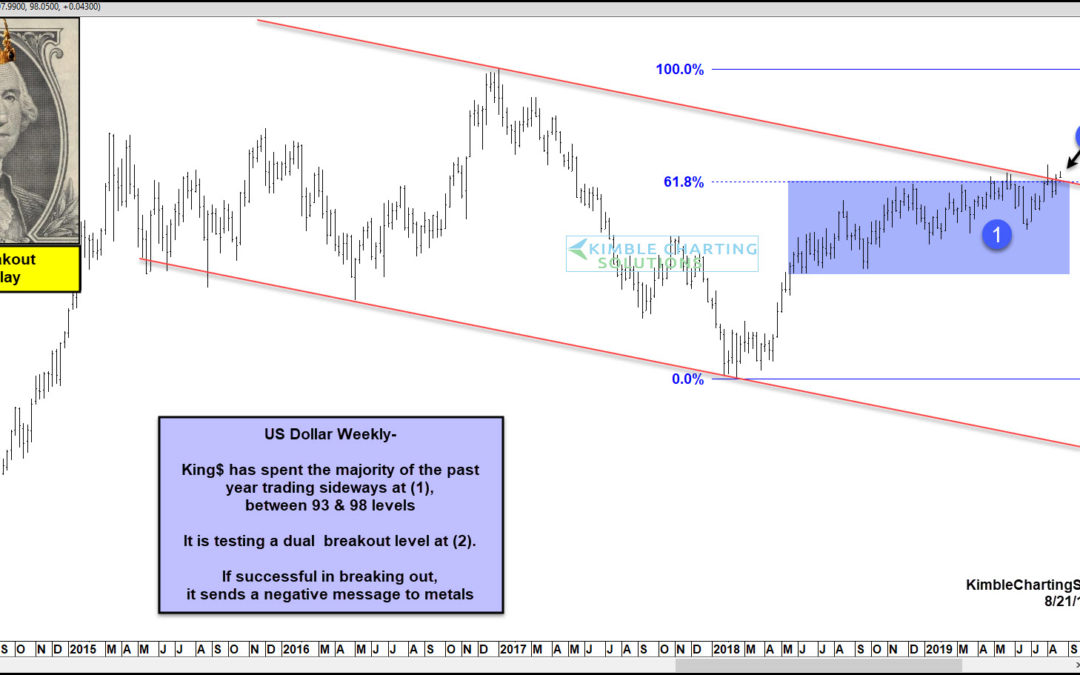
by Chris Kimble | Aug 22, 2019 | Kimble Charting
The US Dollar Index is flexing its muscle of late. Trade wars and fear of a global slowdown have capital fleeing to King Dollar. King dollar breakout test in play? Looking at today’s chart, you can see that the Dollar has been consolidating in a range for the past...
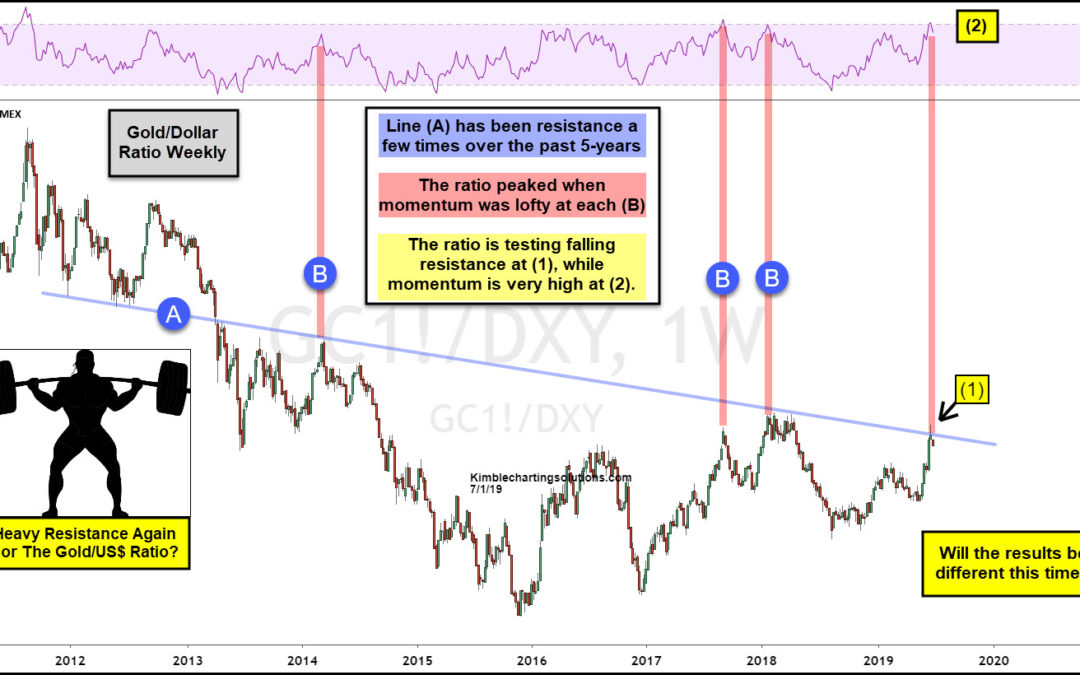
by Chris Kimble | Jul 1, 2019 | Kimble Charting
The Gold rally in June was very impressive. Is the bear market in Gold over? Many are of the opinion a major breakout in Gold has taken place. What this indicator does at current levels could go a long way to seeing if the rally in June will continue into July! The...
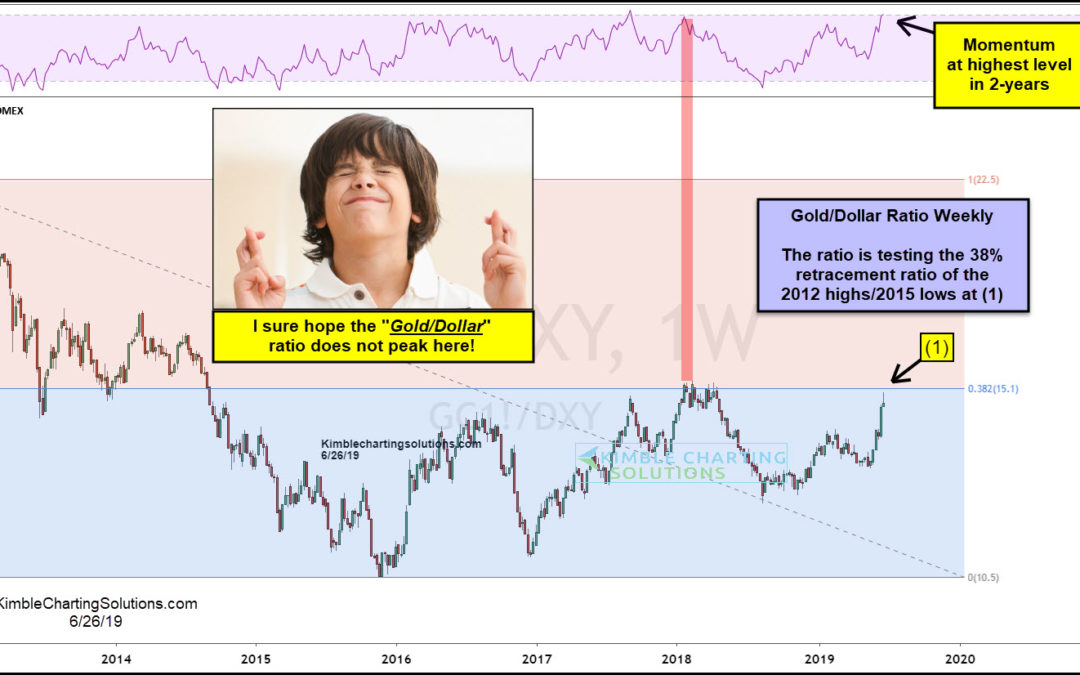
by Chris Kimble | Jun 26, 2019 | Kimble Charting
Gold has been strong of late as the US Dollar has been weak. This combo has driven the Gold/Dollar ratio to a key price zone and momentum level, that looks to be important to metals bulls. This chart looks at the Gold/Dollar ratio over the past 6-years. The long-term...
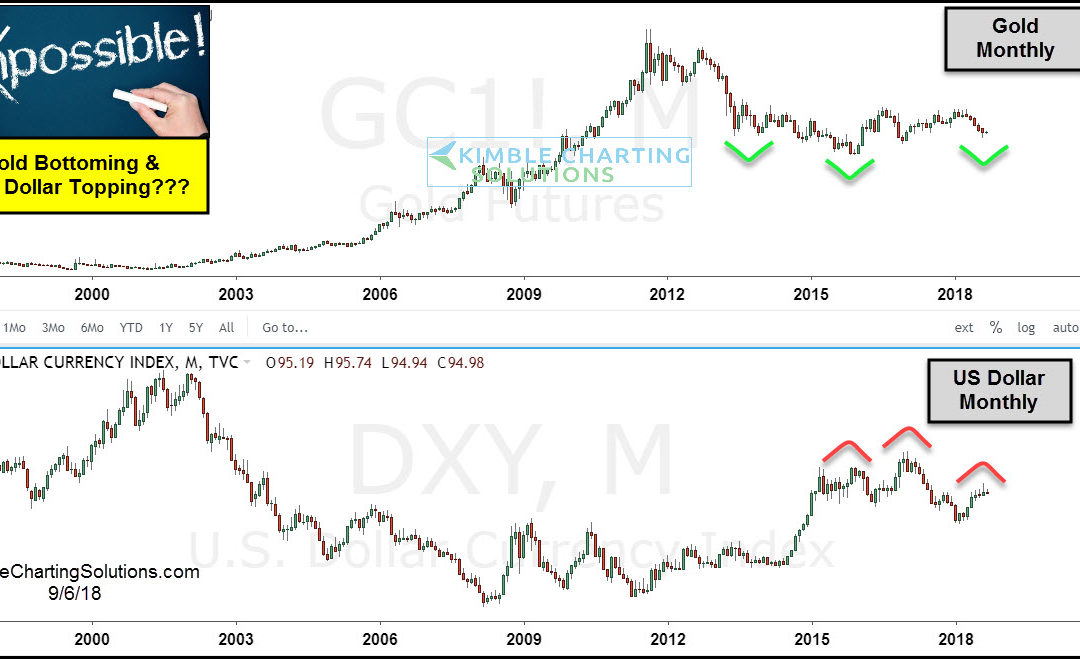
by Chris Kimble | Sep 6, 2018 | Kimble Charting
CLICK ON CHART TO ENLARGE Is it possible that the US Dollar could be creating a multi-year topping pattern, while Gold is creating a multi-year bottoming pattern? I would understand if the majority feels it is almost “impossible,” as the long-term trend...
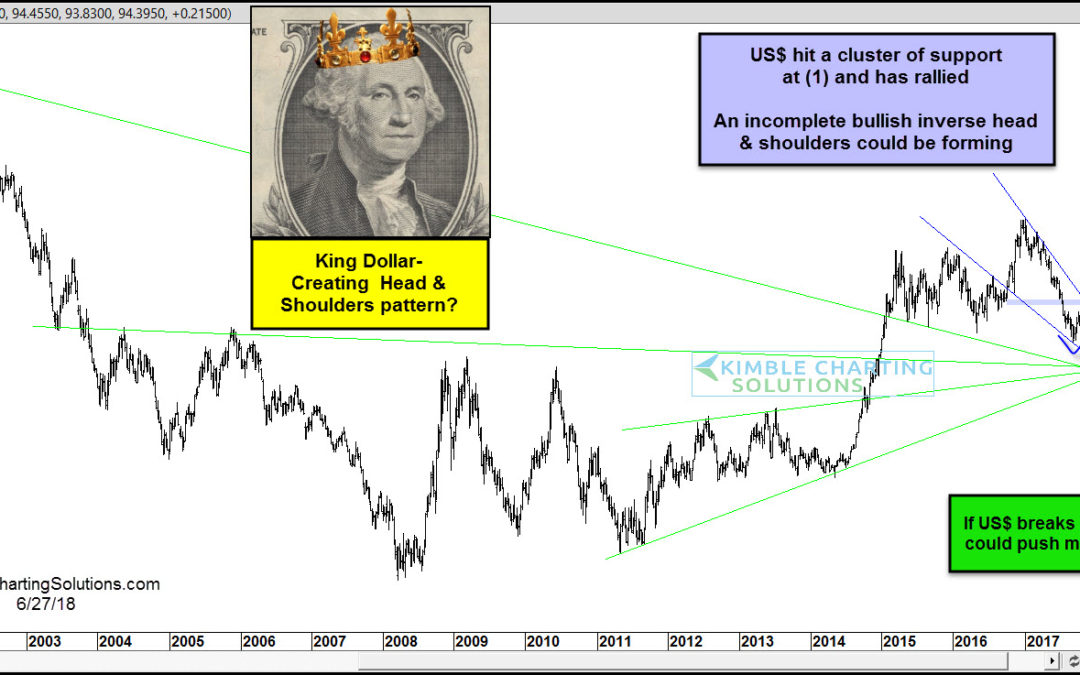
by Chris Kimble | Jun 28, 2018 | Kimble Charting
King Dollar is a major player in the financial markets. And its moves are especially important to commodities and emerging markets. Well, portfolio managers and traders in those markets may want to pay attention to today’s chart because the US Dollar (CURRENCY:USD)...
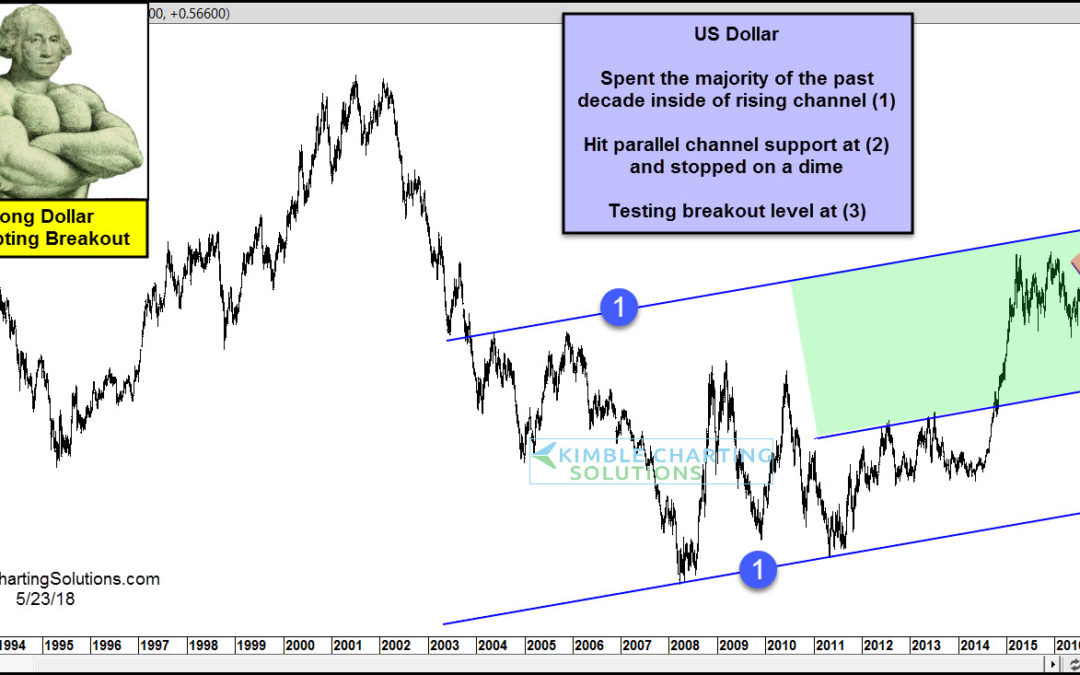
by Chris Kimble | May 24, 2018 | Kimble Charting
The U.S. Dollar Index has been mired in a correction for several months. During that time, stocks, gold, and oil exploded higher in 2017 and early 2018. But the greenback has put together a multi-week rally. Is the correction nearing an end? Looking at the chart...
