
by Chris Kimble | Jul 1, 2014 | Kimble Charting
CLICK ON CHART TO ENLARGE A good friend of mine, Ryan Detrick, CMT shared the chart above along with his comments/perspective on the VIX and I wanted to pass it along on this first day of July. Thanks Ryan for sharing. Historically, July is the best...

by Chris Kimble | May 14, 2014 | Kimble Charting
CLICK ON CHART TO ENLARGE Ever wonder how to make some good monies even when the market is choppy/moving sideways? One month ago today I shared with Premium members that a key opportunity looked to be taking place at support. See below- CLICK ON CHART TO...

by Chris Kimble | Apr 22, 2014 | Kimble Charting
CLICK ON CHART TO ENLARGE From a volatility standpoint, the VIX & VXN have traded in a narrow band since the start of 2013. At the end of January this year, VIX spiked up in a few weeks and Premium Members shorted the VIX, buy purchasing XIV as it was on...

by Chris Kimble | Apr 14, 2014 | Kimble Charting
CLICK ON CHART TO ENLARGE By now we all know Bio Tech and Social media darlings have been hit hard of late, which could be masking that the broad market is NOT! So far the S&P 500 is off less than 4% from 200-year highs. Is that much reason to be fearful?...
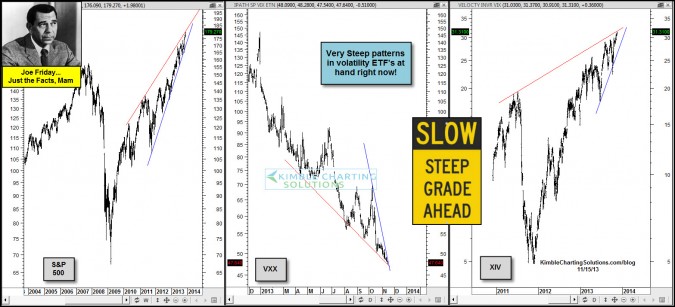
by Chris Kimble | Nov 15, 2013 | Kimble Charting
CLICK ON CHART TO ENLARGE The sharp rally in the S&P 500 this year has created very steep patterns in volatility ETF’s (XIV& VXX) Joe Friday…Low back and forth Volatility in these ETF’s (XIV & VXX) hasn’t been the case of late, due...

by Chris Kimble | Aug 28, 2013 | Kimble Charting
CLICK ON CHART TO ENLARGE On June 27th I shared with Premium Members that the Fear Index was at resistance and SPY was on support, as the “Shoe Box Indicator” was on support too (see chart below) and that a RALLY WAS DUE! . What followed? Get “Shoe...

by Chris Kimble | Jun 27, 2013 | Kimble Charting
CLICK ON CHART TO ENLARGE Fear index (VIX) has moved higher over the past month, hitting a falling resistance line that has stopped its rise in price over the past couple of years. At the same time the S&P 500 is near is rising support line that has been in place...
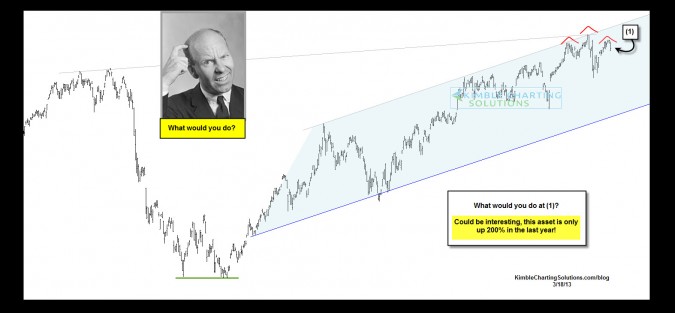
by Chris Kimble | Mar 21, 2013 | Kimble Charting
CLICK ON CHART TO ENLARGE Is one of the “Hottest ETF’s” on the planet creating a “Head & Shoulders” topping pattern? The above chart was the quiz from 3 days ago. This chart reflects a potential “Head & Shoulders”...
