
by Chris Kimble | Feb 11, 2016 | Kimble Charting
The Power of the Pattern would describe a bull trend, based upon a series of higher lows and higher highs. Using this definition, the broadest of indices in the states, are “breaking 5-year rising trends!” This could break the heart of the bulls. CLICK ON...

by Chris Kimble | Jan 14, 2016 | Kimble Charting
CLICK ON CHART TO ENLARGE Last week was rough for stocks, as the S&P 500 opened the year with the “worst first week of the year, ever!” The second week hasn’t been much to brag about, from the bullish camp, as prices have continued to fall. I...
by Chris Kimble | Feb 20, 2015 | Kimble Charting
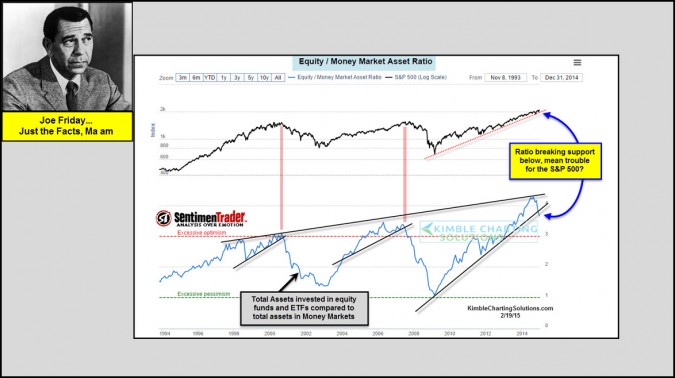
CLICK ON CHART TO ENLARGE The bottom chart above from Sentiment Trader, reflects that the Equity to Money market ratio was recently hitting all-time high levels. Of late the ratio is turned a little lower and broke below a rising support line. Humbly, I don’t...
by Chris Kimble | Oct 14, 2014 | Kimble Charting
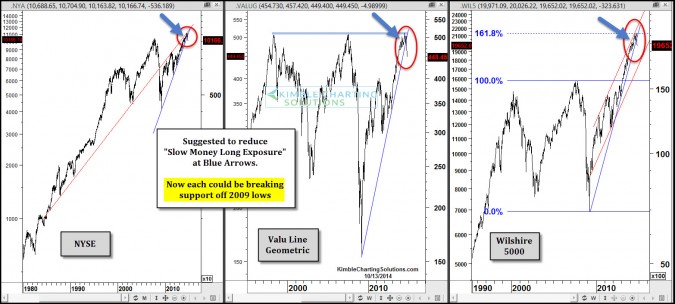
CLICK ON CHART TO ENLARGE The Power of the Pattern suggested to pull some “Slow Money Long Exposure” off the table at the blue arrows above. One of our goals is to help financial professionals and investors who don’t care to trade very...

by Chris Kimble | Apr 7, 2014 | Kimble Charting
CLICK ON CHART TO ENLARGE This 5-pack of chart focuses on key U.S. stock index’s and how each of them are facing key long-term lines at the exact same time and a couple of them are facing Fibonacci extension levels too. If one breaks out will all...
by Chris Kimble | Mar 11, 2014 | Kimble Charting
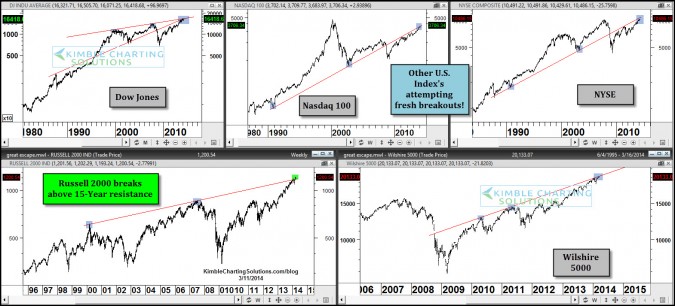
CLICK ON CHART TO ENLARGE Several popular U.S. stock index’s are at or near all time highs. Of late the Russell 2000 just broke above a 15-year resistance line. Now we will soon see if the Dow, NDX, NYSE and Wilshire 5000 follow suit. CLICK ON CHART...

by Chris Kimble | Feb 10, 2014 | Kimble Charting
CLICK ON CHART TO ENLARGE A week ago today, the Dow fell 300 points, broke a couple of support lines+ and moving averages. News stories appeared about a 1929 repeat and were discussed a good bit and VIX fear levels jumped up a large percentage. Due...
by Chris Kimble | Nov 20, 2013 | Kimble Charting
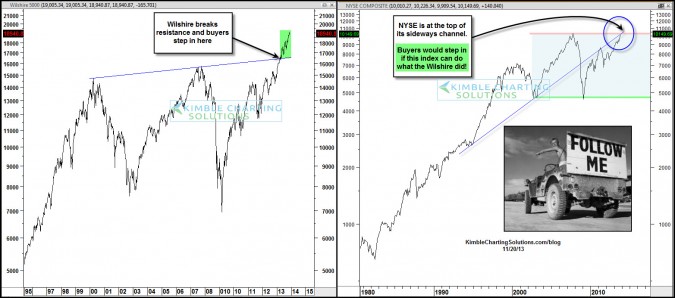
CLICK ON CHART TO ENLARGE Buyers jumped on board the Wilshire 5000 index once it broke resistance in the left chart above, which was a positive for this very broad index, pushing it almost vertical on this chart. Now another broad index is attempting a breakout. The...
