by Chris Kimble | Jun 28, 2012 | Kimble Charting
CLICK ON CHART TO ENLARGE Traders appear to have created bearish Head & Shoulders patterns in the Copper complex and Europe. Each asset in the 4-pack above reflects a similar pattern, as each looks to be testing their neckline! Even though each...

by Chris Kimble | Jun 4, 2012 | Kimble Charting
CLICK ON CHART TO ENLARGE The patterns DON’T reflect that the world is going to end! If this pattern read is correct, the Vanguard World Index ETF (VEU) could end up much lower in price though! The neckline needs to hold right now! A break of the...

by Chris Kimble | Jun 10, 2011 | Kimble Charting
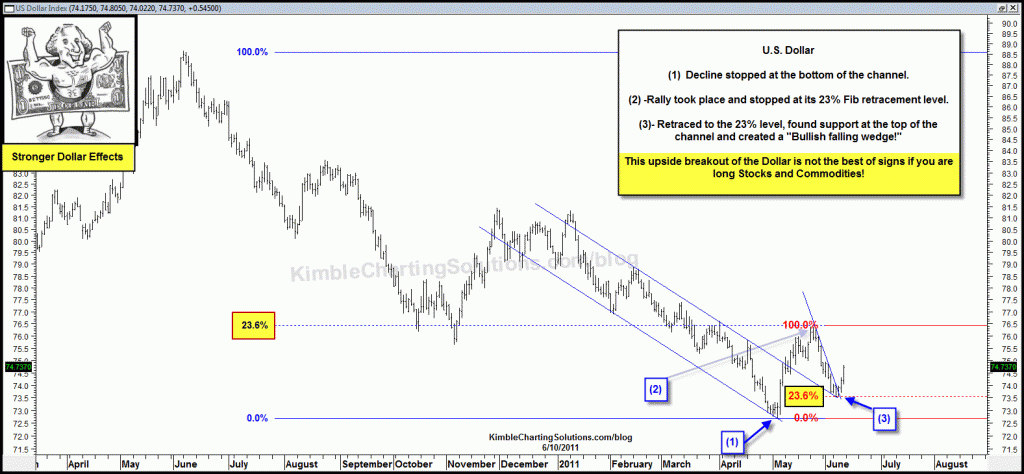
Have shared twice this week that the “Power of the Pattern” was suggesting a U.S. Dollar rally was close at hand…. “Dollar Support” (see post here) and “Dollar breakout” (see post here) Below is an...

by Chris Kimble | May 24, 2011 | Kimble Charting
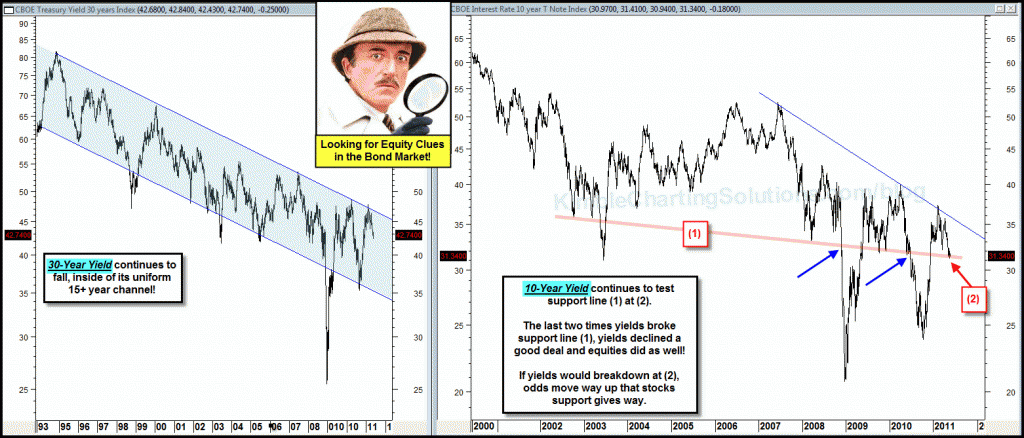
CLICK ON CHART TO ENLARGE Long-Term yields remain inside of a very uniform falling channel, continuing a series of “lower highs.” The 10-year continues to create a series of “lower highs” as well, bringing yields down to a level/support...

by Chris Kimble | May 17, 2011 | Kimble Charting
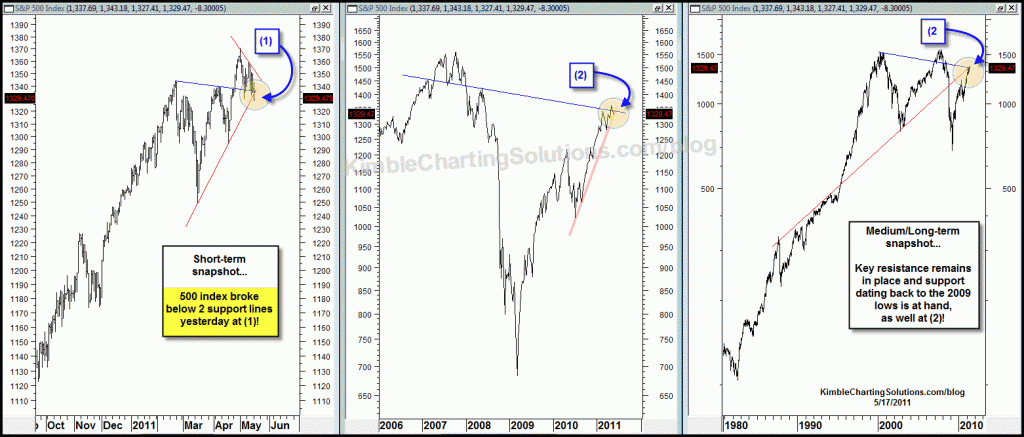
CLICK ON CHART TO ENLARGE On a very short-term basis, the 500 index broke below two support lines yesterday at (1). This break doesn’t determine a ton, nor create a trend, yet it should be respected! On a bigger picture, the 500 index remains jammed...

by Chris Kimble | May 14, 2011 | Kimble Charting
CLICK ON CHART TO ENLARGE Markets around the world (S&P 500, Russell 2000, EAFE, Emerging, Shanghai and more) have all formed “Look Alike” Patterns, each testing key support at (1)! With correlation so high around the...

by Chris Kimble | Nov 4, 2010 | Kimble Charting
Due to the “Power of the Pattern” the suggestion was made to buy stocks the last day of August (see post here). Did I know one of the best September’s in decades would take place? I wish… but the answer is a clear NO! I deeply liked what I...

by Chris Kimble | Oct 22, 2010 | Kimble Charting
Emerging markets, especially some of the smaller countries have been “HOT PERFORMERS” over the last 6 months, as the U.S. Dollar has declined over 15% since it peaked in June. See performace below, compared to the 500 index! CLICK ON CHART TO...


