by Chris Kimble | Apr 17, 2018 | Kimble Charting
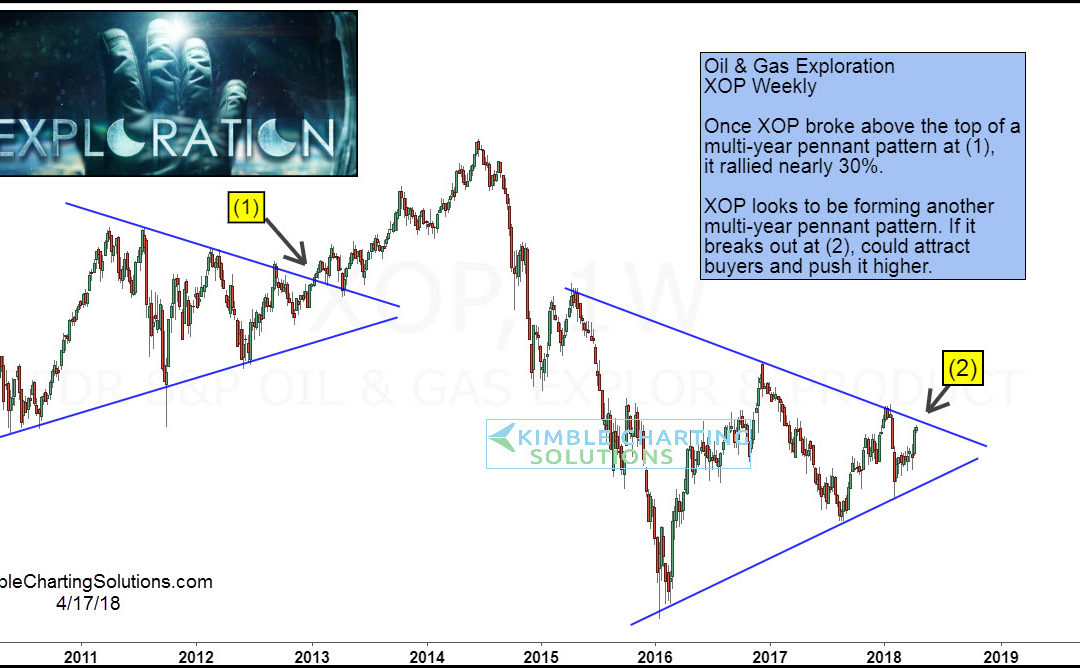
CLICK ON CHART TO ENLARGE The chart above looks at Oil & Gas Exploration EFT (XOP) over the past 8-years. From 2010 until 2013 it looks to have created a pennant pattern (series of higher lows and lower highs). Once resistance was taken out at (1), buyers came...

by Chris Kimble | Nov 7, 2017 | Kimble Charting
Crude Oil has been strong of late. Did you realize that Crude Oil has gained more in the past month than the S&P 500 has this year, see chart below. CLICK ON CHART TO ENLARGE The strong rally of late has Crude testing what appears to be a very important level in...

by Chris Kimble | Oct 31, 2017 | Kimble Charting
Crude Oil has been moving higher of late, putting it at a price point that looks to be important from a long-term perspective. Below looks at Crude Oil over the past 10-years and how it is facing a key breakout test on Halloween- CLICK ON CHART TO ENLARGE As mentioned...

by Chris Kimble | Oct 13, 2017 | Kimble Charting
Just The Facts- Energy ETF (XLE) has lagged the S&P 500 by a large margin over the past three years, reflected in the chart below- CLICK ON CHART TO ENLARGE The chart above reflects that XLE has underperformed the S&P 500 by nearly 60% over the past three...
by Chris Kimble | Oct 6, 2017 | Kimble Charting
Crude Oil has rallied for the past few months, could it be peaking? Joe Friday suggests Crude finds itself at a key inflection point for it and its Fear Index (OVX). Below looks at Crude Oil futures over the past decade- CLICK ON CHART TO ENLARGE Crude Oil rally of...

by Chris Kimble | Oct 2, 2017 | Kimble Charting
Crude Oil has been moving sharply higher the past few weeks. Last week we shared with Sectors Extreme & Premium members that Crude Oil had created an important pattern to finish the week while hitting an important price point. Below looks at the chart shared with...

by Chris Kimble | Sep 20, 2017 | Kimble Charting
Oil & Gas Exploration stocks have been hit hard over the past few years, falling over 50%. Could an opportunity be at hand in this hard-hit sector? Possible! Below looks at the chart of Oil & Gas Exploration ETF (XOP) over the past few years. CLICK ON CHART TO...

by Chris Kimble | Sep 6, 2017 | Kimble Charting
Oil Drillers have had little to smile about over the past years. Could this trend be about to end? A pattern is in play that highlights a counter trend rally could be near. Below looks at the Oil Drillers (XOP)/ S&P 500 Ratio over the past couple of years- CLICK...
