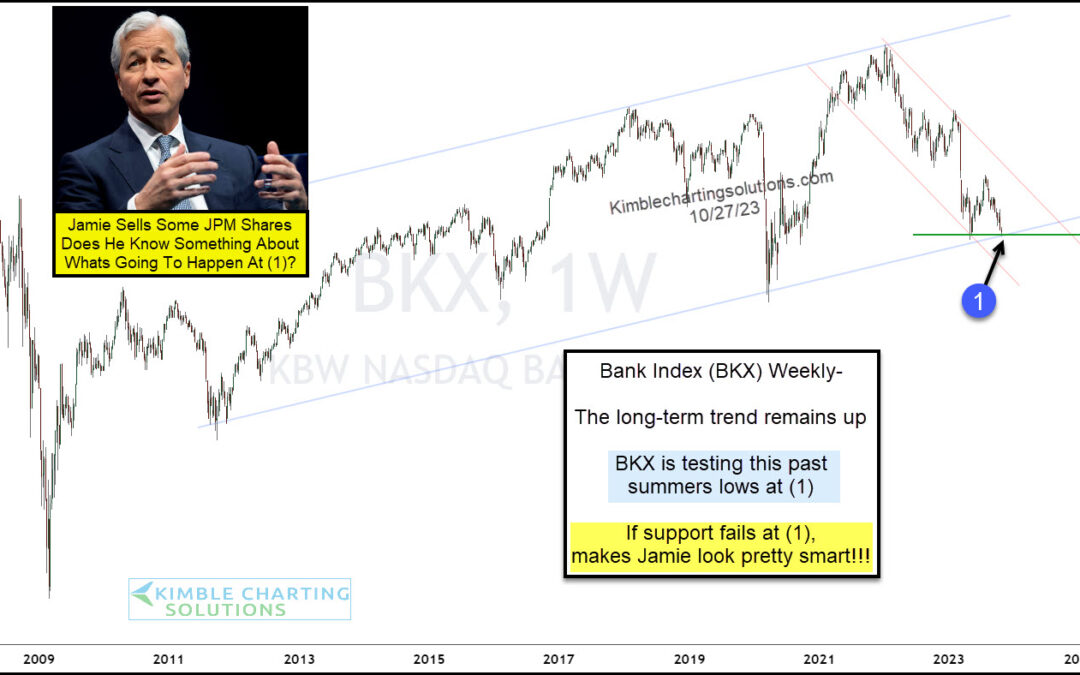
by Chris Kimble | Oct 30, 2023 | Kimble Charting
For this first time in his tenure as JPMorgan Chase president, Jamie Dimon sold some shares on Friday. Does he know something that we should know? Are bank stocks in trouble?? Well, it’s time to look at the banks… above is a “weekly” chart of the Bank Index (BKX). As...
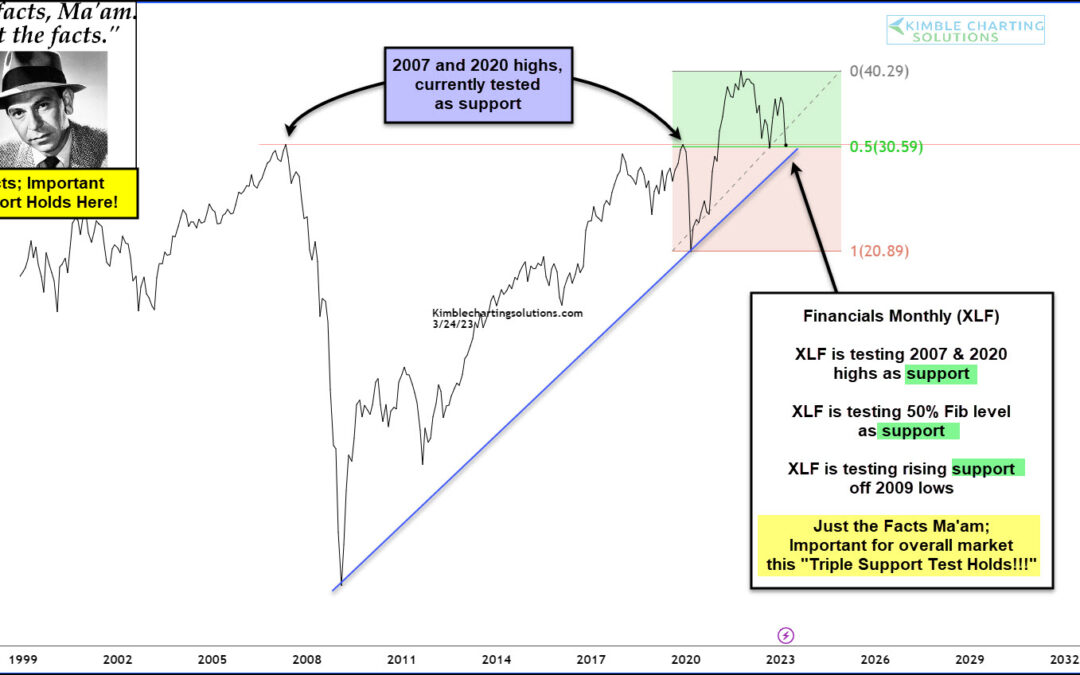
by Chris Kimble | Mar 24, 2023 | Kimble Charting
The financial sector is the focal point of the global economy. So it’s no wonder that investors pay close attention to its performance within the stock market. And this is especially true when recession fears rise due to lackluster economic growth. Kinda sounds like...
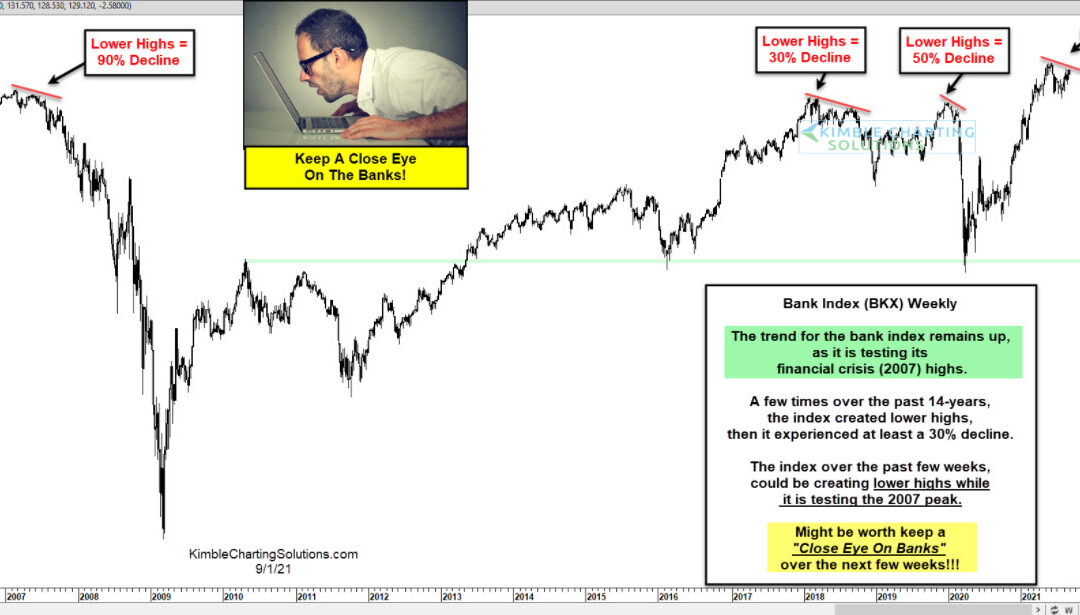
by Chris Kimble | Sep 2, 2021 | Kimble Charting
Investors understand the importance of banks to the economy and the broader market. And since bottoming with the coronavirus crash, the $BKX Bank Index has more than doubled. BUT, this year has seen the Bank Index slow its roll – see point (1) on the $BKX “weekly”...
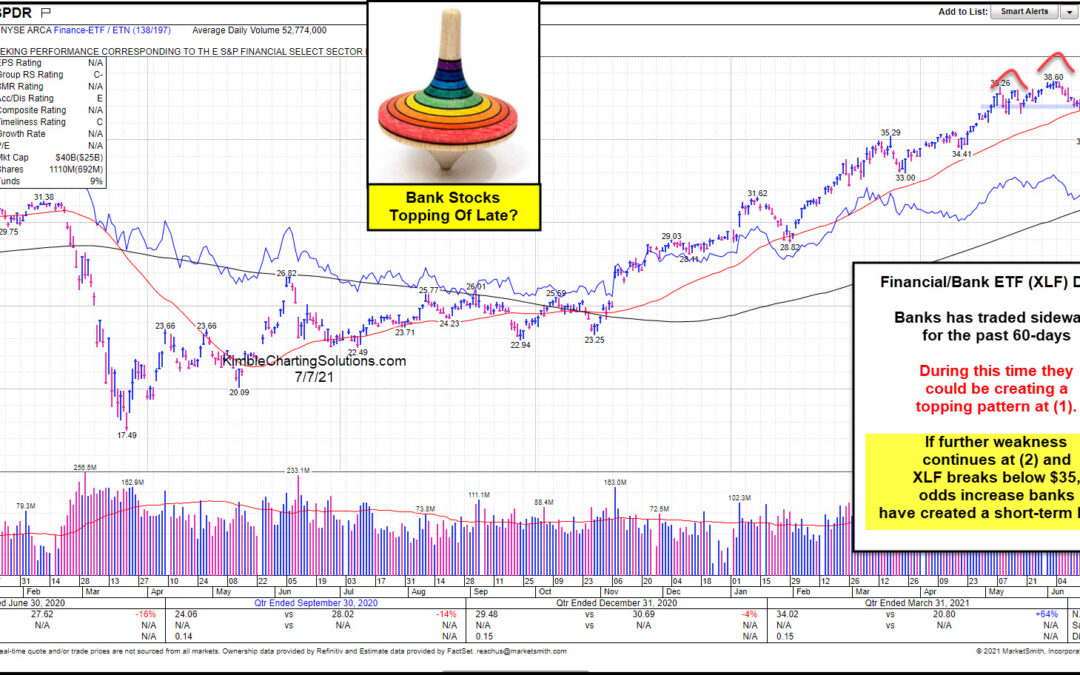
by Chris Kimble | Jul 7, 2021 | Kimble Charting
Financial and bank stocks have been lagging the broad market for the past month. While the S&P 500 is posting new all-time highs, the SPDR Financial Sector ETF (XLF) is trading below its highs. This chart comes from Marketsmith.com, by Investors Business Daily! So...
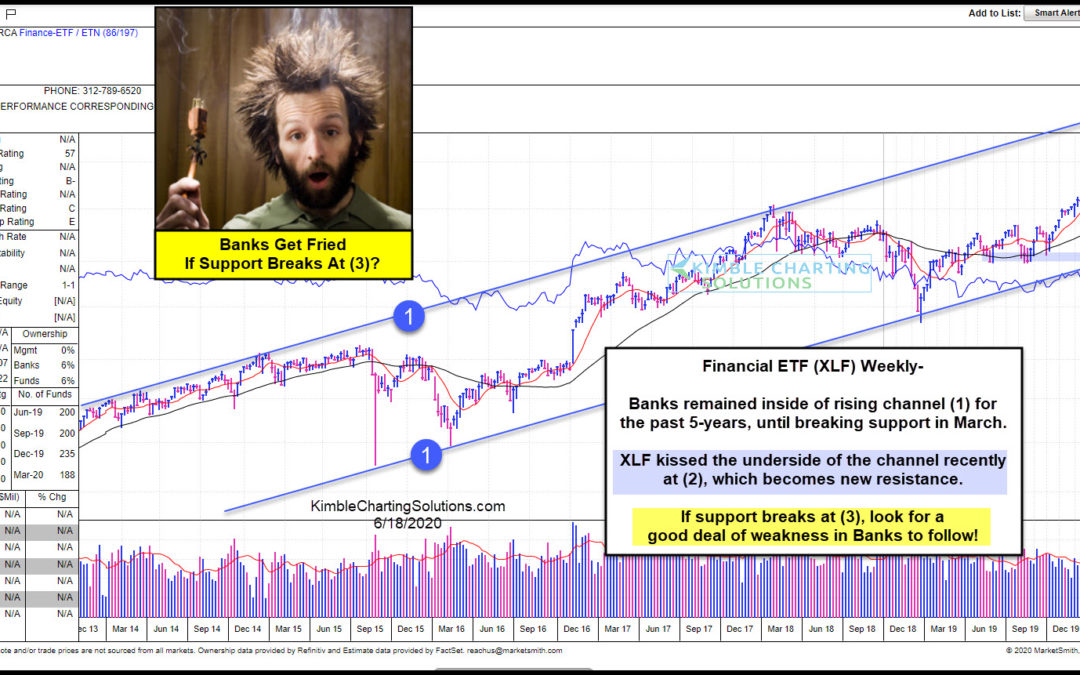
by Chris Kimble | Jun 18, 2020 | Kimble Charting
Are banks about to get fried? Sure could if current support fails to hold! This chart looks at Financial ETF (XLF) from Marketsmith.com on a weekly basis over the past 7-years. XLF has remained inside of bullish rising channel (1) for the past 5-years. Weakness took...
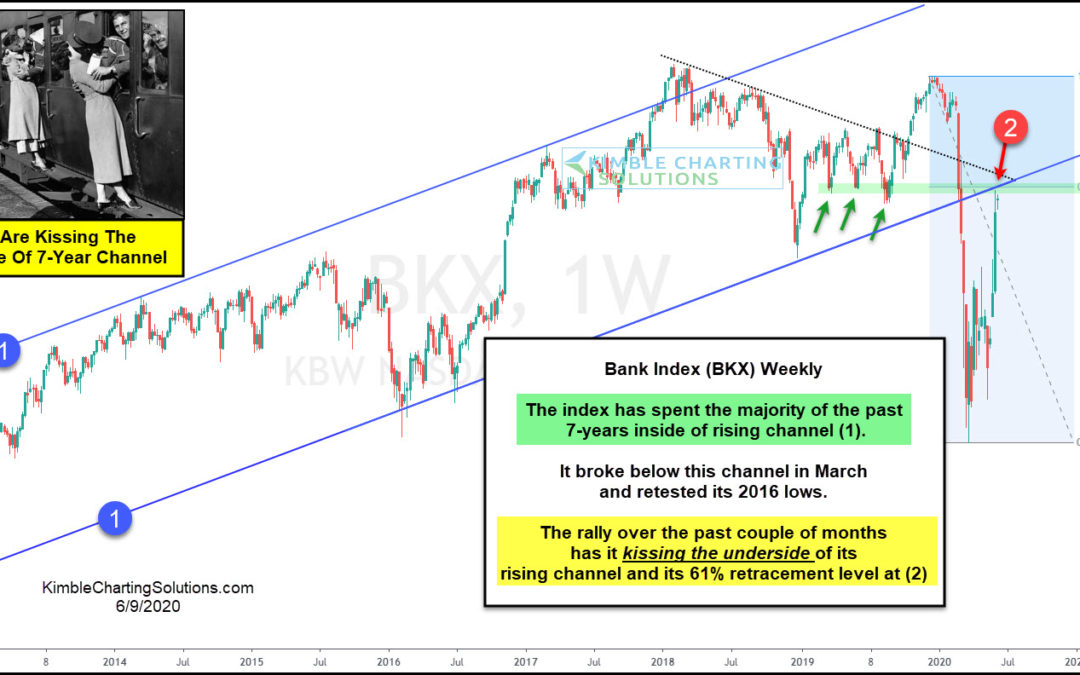
by Chris Kimble | Jun 9, 2020 | Kimble Charting
If Banks peak here would they send a caution message to the stock rally over the past couple of months? Yes! This chart looks at the Bank Index (BKX) on a weekly basis since the summer of 2012. Since the lows in July of 2012, the index has spent the majority of the...
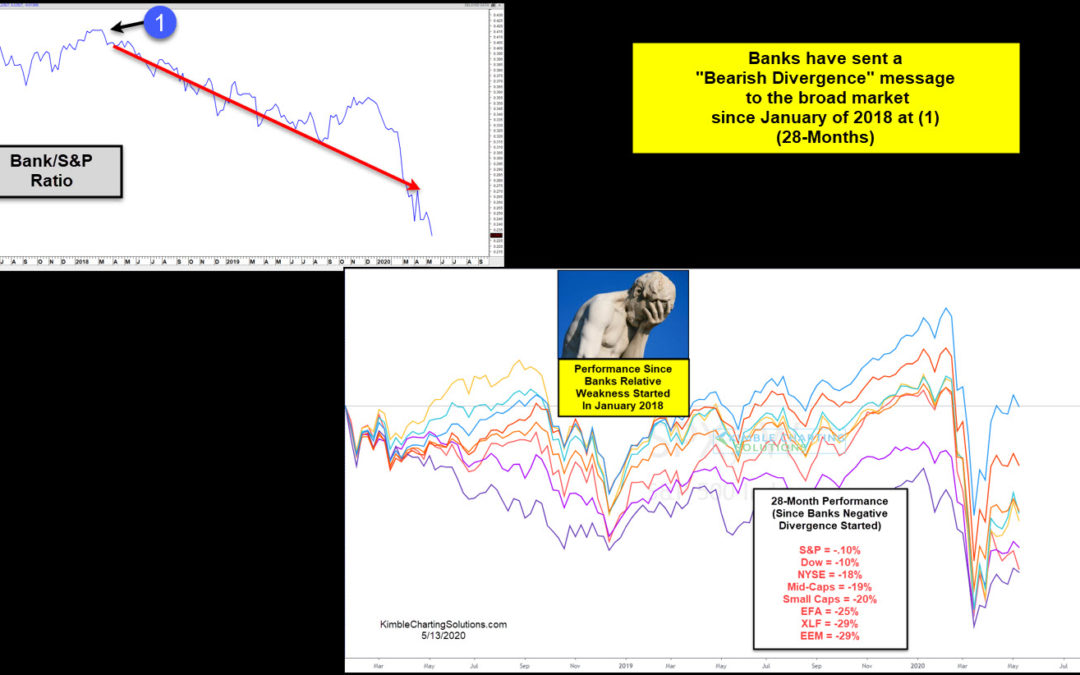
by Chris Kimble | May 13, 2020 | Kimble Charting
Is the saying “So Goes The Banks, So Goes The Broad Market” true? Over the past 28-months, it does appear to be accurate! Banks started underperforming the S&P 500 in January of 2018 (28-months ago) at (1) in the upper left chart. This weakness from...
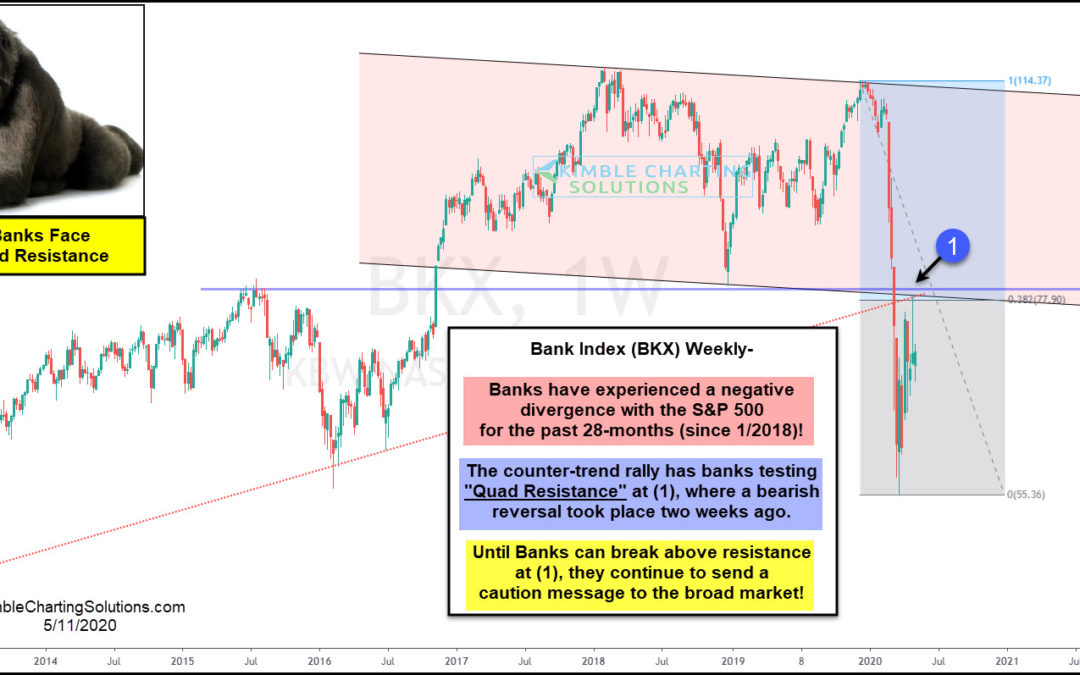
by Chris Kimble | May 11, 2020 | Kimble Charting
Is the Banking Index sending a caution message to stocks? It has for the past 28-months and it is experiencing a major resistance test of late! The Banking Index (BKX) started underperforming the broad market back in January of 2018, which created a negative...
