by Chris Kimble | Oct 7, 2013 | Kimble Charting
CLICK ON CHART TO ENLARGE The chart directly below reflects a 6 month rally from 11/20/12 to 5/20/12 of the Nikkei and S&P 500, in which the Nikkei gained over 48% more than SPY. I am of the belief that its important to watch the action of the hottest stock...

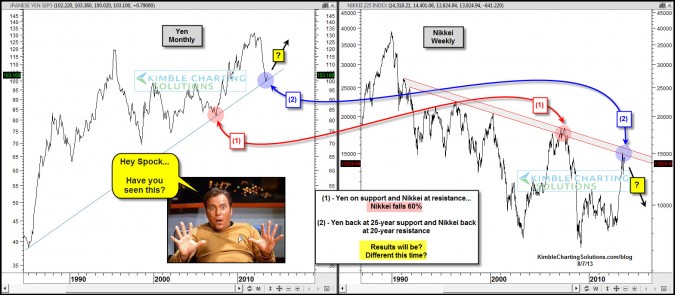
by Chris Kimble | Aug 27, 2013 | Kimble Charting
CLICK ON CHART TO ENLARGE The Yen has a decent track record in helping investors construct their portfolios towards the Risk on or Risk off trade! The yen is on a 20-year support line right now (monthly basis) at (2) in the chart above. On a daily basis the Yen has...
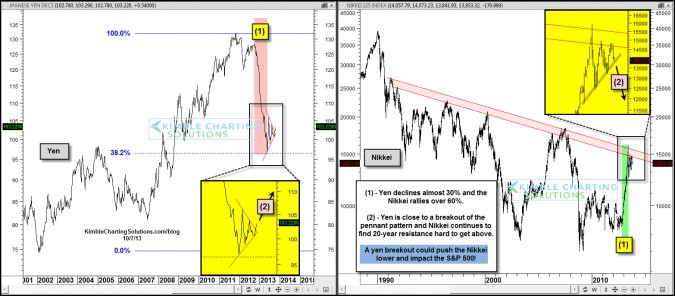
by Chris Kimble | Aug 7, 2013 | Kimble Charting
CLICK ON CHART TO ENLARGE What currency has rallied and in turn the Nikkei and S&P 500 have fallen hard at the same time? When the Yen has hit the 20-year support line in the left chart the Nikkei and SPY fell hard (50%+ for both) back in 2007 at (1). Now...

by Chris Kimble | Jun 3, 2013 | Kimble Charting
CLICK ON CHART TO ENLARGE From a monthly basis, the U.S. Dollar created another large bearish wick along an 8-year resistance line at (1) in the chart above. This might surprise a few investors as the Dollar is a popular investment choice right now, as 77% of...

by Chris Kimble | May 17, 2013 | Kimble Charting
CLICK ON CHART TO ENLARGE The Yen, Australian $ and the Euro have created pennant patterns over the past few years and each of these currencies is now breaking support of the pennant patterns. As the same time the US$ has been unable to “Close on a...

by Chris Kimble | May 15, 2013 | Kimble Charting
CLICK ON CHART TO ENLARGE The Japanese Yen (left chart above) created a multi-year flag pennant pattern, reflected by a series of higher lows and lower highs. Once traders broke the bottom of the pennant, sellers rushed in, creating one of the largest currency...

by Chris Kimble | Apr 13, 2013 | Kimble Charting
CLICK HERE TO WATCH INTERVIEW I was deeply honored to do a live interview with Phil Pearlman, Executive Editor of StockTwits yesterday. Thanks for the opportunity to share some of my thoughts and current charts with you and your viewers Phil! See us here on...

by Chris Kimble | Apr 10, 2013 | Kimble Charting
CLICK ON CHART TO ENLARGE The U.S. Dollar has declined against the Yen for the majority of the past 30-years, reflected in the chart above. An important high in the US$/Yen took place back in 2007, as well as a high in the S&P500. Now the US$/Yen is facing a...
