“Power of the Chart Pattern”
for Financial Professionals
Investment Research that Visualizes the Action to Take
Click Image to Enlarge
Click Image to Enlarge
How Visualizing Your Investment Decisions is Beneficial
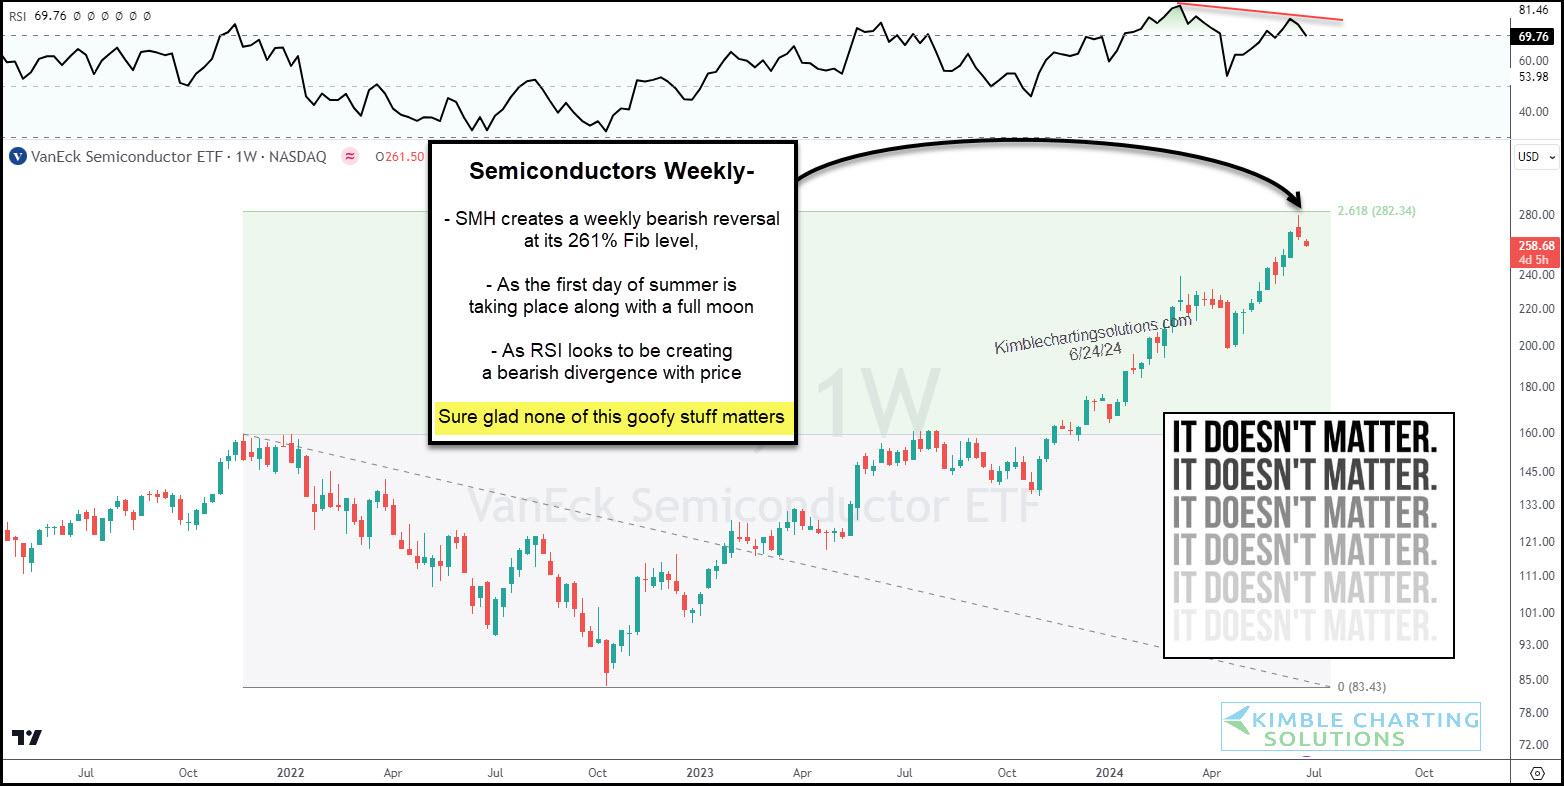
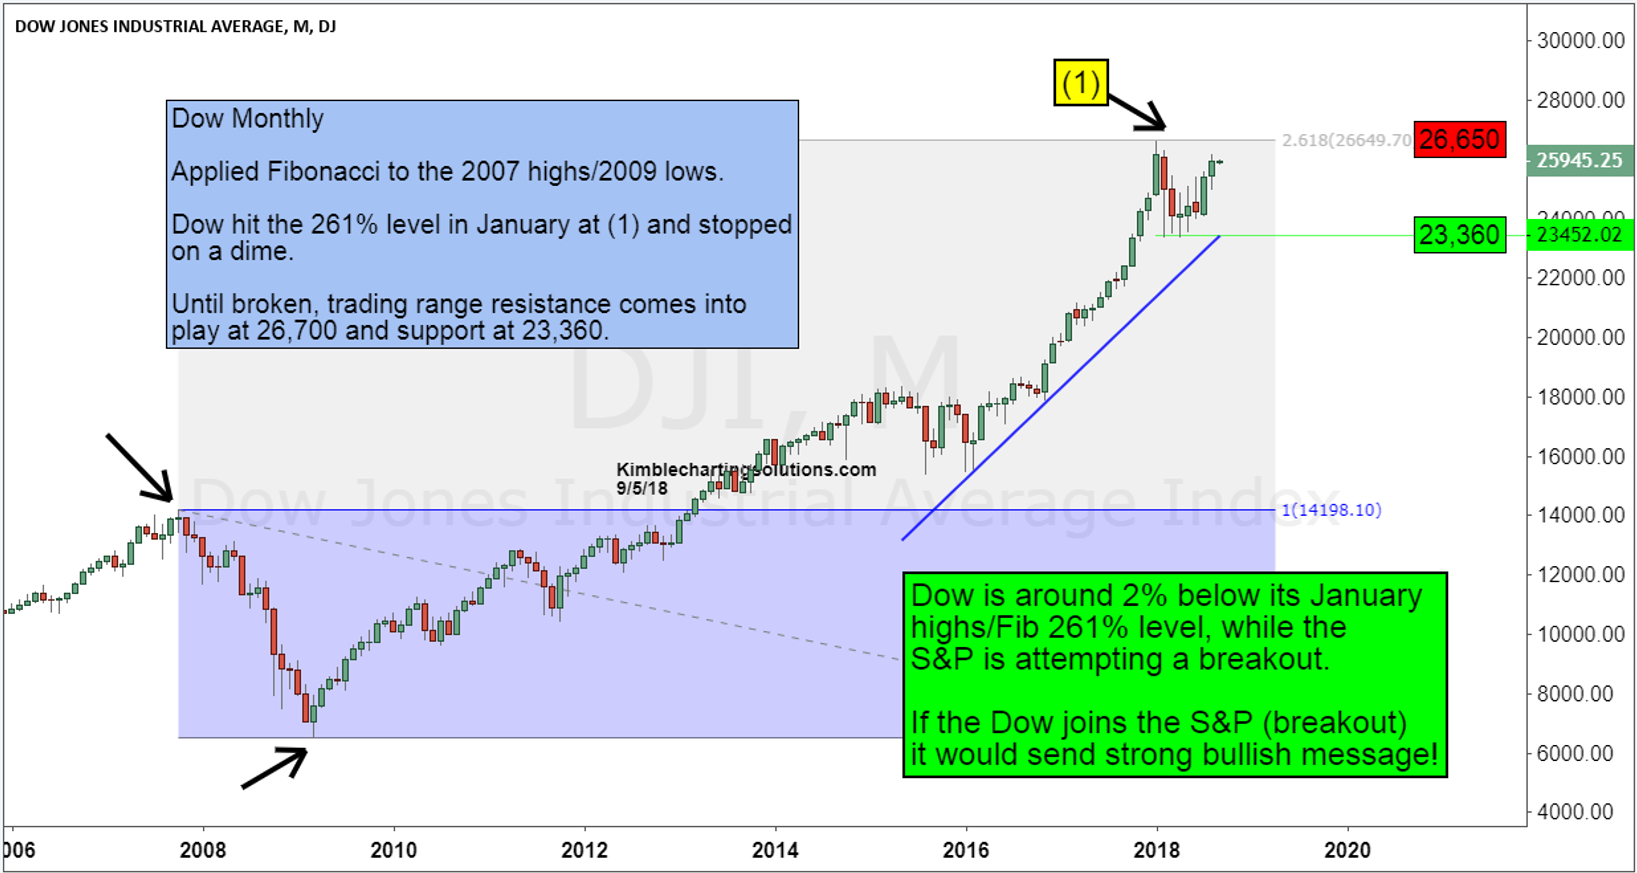
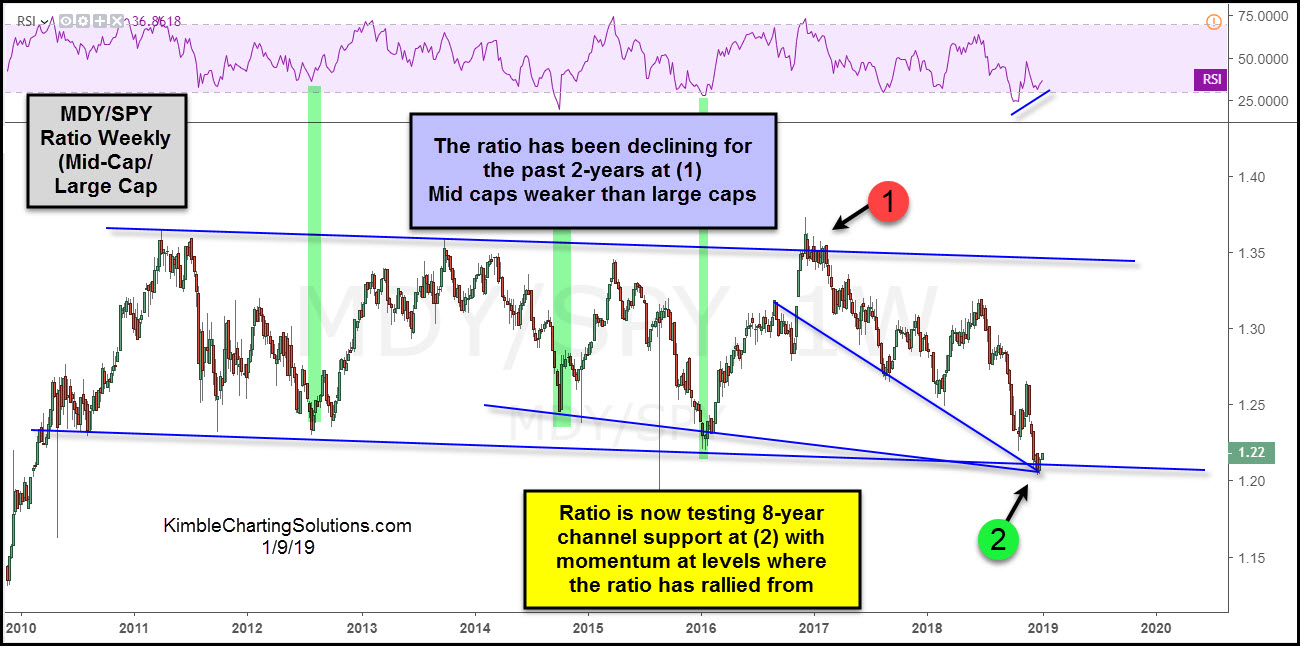
- Big picture charts visualizes trends & patterns to confirm/challenge portfolio decisions
- Clearly Identifies breakout & reversal patterns that fundamental research cannot provide
- Strengthens convictions when it’s time to change course
- A tremendous time saver to help you stay informed on positions and markets
“Chris, thanks to your research I was added to Forbes list of top advisors in the U.S. for 2017″ John G, Financial Advisor
An Extension of Your Team
- giving you more time to focus on profitable activities
- searching the world to identify high probability reversal & breakout chart patterns for you
- producing clear – concise trends & patterns to visualize market risk and opportunities with your clients
- equipping you with backup for your recommendations & positions for ever increasing oversight
- Backing up your fundamental analysis for greater confidence in your portfolio decisions

Select Your Research
PREMIUM
Research
$397/m
(20% discount with annual subscription)
_________________________________
DAILY Research
Hundred Chart Patterns Monitored Daily
Pattern Analysis & Setups Identified for you in:
Global Indices, Sectors, Commodities & Metals & Select Individual Stocks
Real Time Alerts on New Positions Emailed to Your inbox
12-15 New Setups Per Month (avg)
Live Premium Member “Connect Series” Webinars
Pattern Analysis & Relative Strength Trade Opportunities in Individual Stocks
All Weekly Research Included
Occasional custom pattern analysis on a specific asset of interest to you
PREMIUM RESEARCH PRODUCT DETAILS
Weekly-Combo
Research
$134/m
__________________________________
Chris’s 3 Weekly Reports Combined
(3rd Report is FREE)
Pattern Analysis & Setups Identified for you in:
Global Indices, Sectors, Commodities & Metals & Select Individual Stocks
Real Time Alerts on New Positions Emailed to Your inbox
4-6 Setups Per Month (avg)
Recording of Premium Member Webinars (FREE)
Global Trends
Report
$67/m
________________________________
Weekly Research Report Sent to Your Inbox
Specifically Designed for “long term” client assets
Big Picture Trend & Pattern Analysis
to Improve Your Portfolio Timing in:
U.S., Developed, Emerging Mkts,
Commodities, Currencies, Gold
Leading “Advance Warning” indicators
Start Visualizing Your Research
Chris’s research is easy to read. His quick summary with pointers are helpful.
I can review the weekly Global Trends report in less than 10 minutes.
He provides us a useful tool to build conviction on potential market movements.
Chris’ thoughts, pointers, and warnings are very useful to assist me with analysis for my clients.
Chris, thanks to some of your calls, I was added to Forbes list of top advisors in the US for 2017!.
What I find most important about the research is the overall macro view of many different asset classes/sectors at the same time.
So in many cases; just having the confidence in a market like SPY and NDX will help someone like me to ignore all of the noise and keep a simple approach.
It really often tells a concise story and raises great technical bullet points that I can share in client meetings.
Chris, thank you so much for your work, I am really happy with my subscription.
I am a fundamental type but realize the importance of the chart patterns. I have come to look at your charts as profitable works of art!
I feel all my bases are covered, particularly in the bond/ interest rate arena.
Thanks again!