Identify with Some of These Challenges?
- Struggle to determine quality entry and exit points
- Struggle to identify significant market turning points
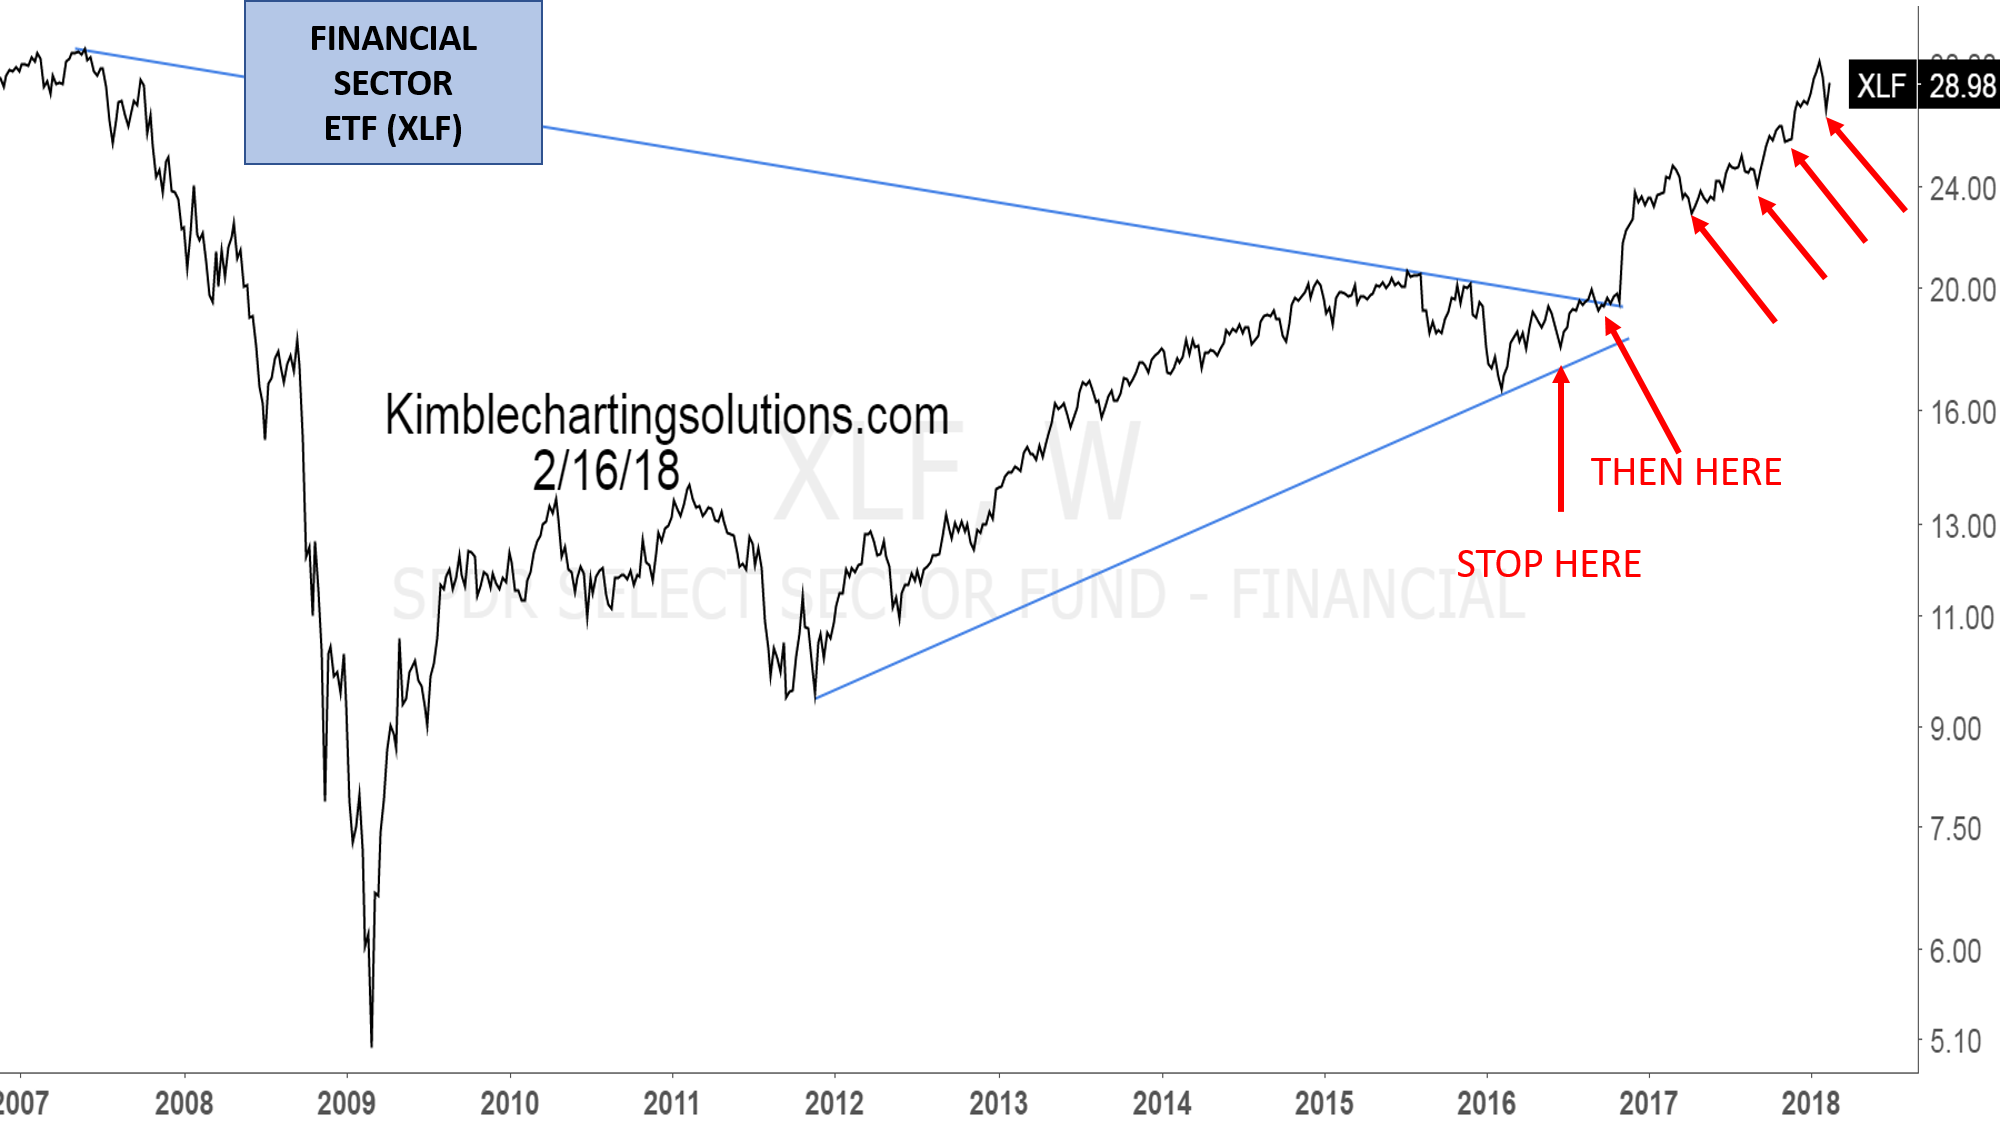
- Need help minimizing downside risk / stop losses
- Second-guess research and need a reliable resource for confirmation
- Don’t always have the confidence to pull the trigger
- Confident in your research but want a quality technician’s work to confirm or challenge conclusions
- Need help finding extreme support and resistance levels
- Do mostly fundamental research, but alone doesn’t assist in timely entry and exits
- Want an objective way to make investment decisions, not based on news and opinions
How The Power of the Chart Pattern Meets These Challenges
1
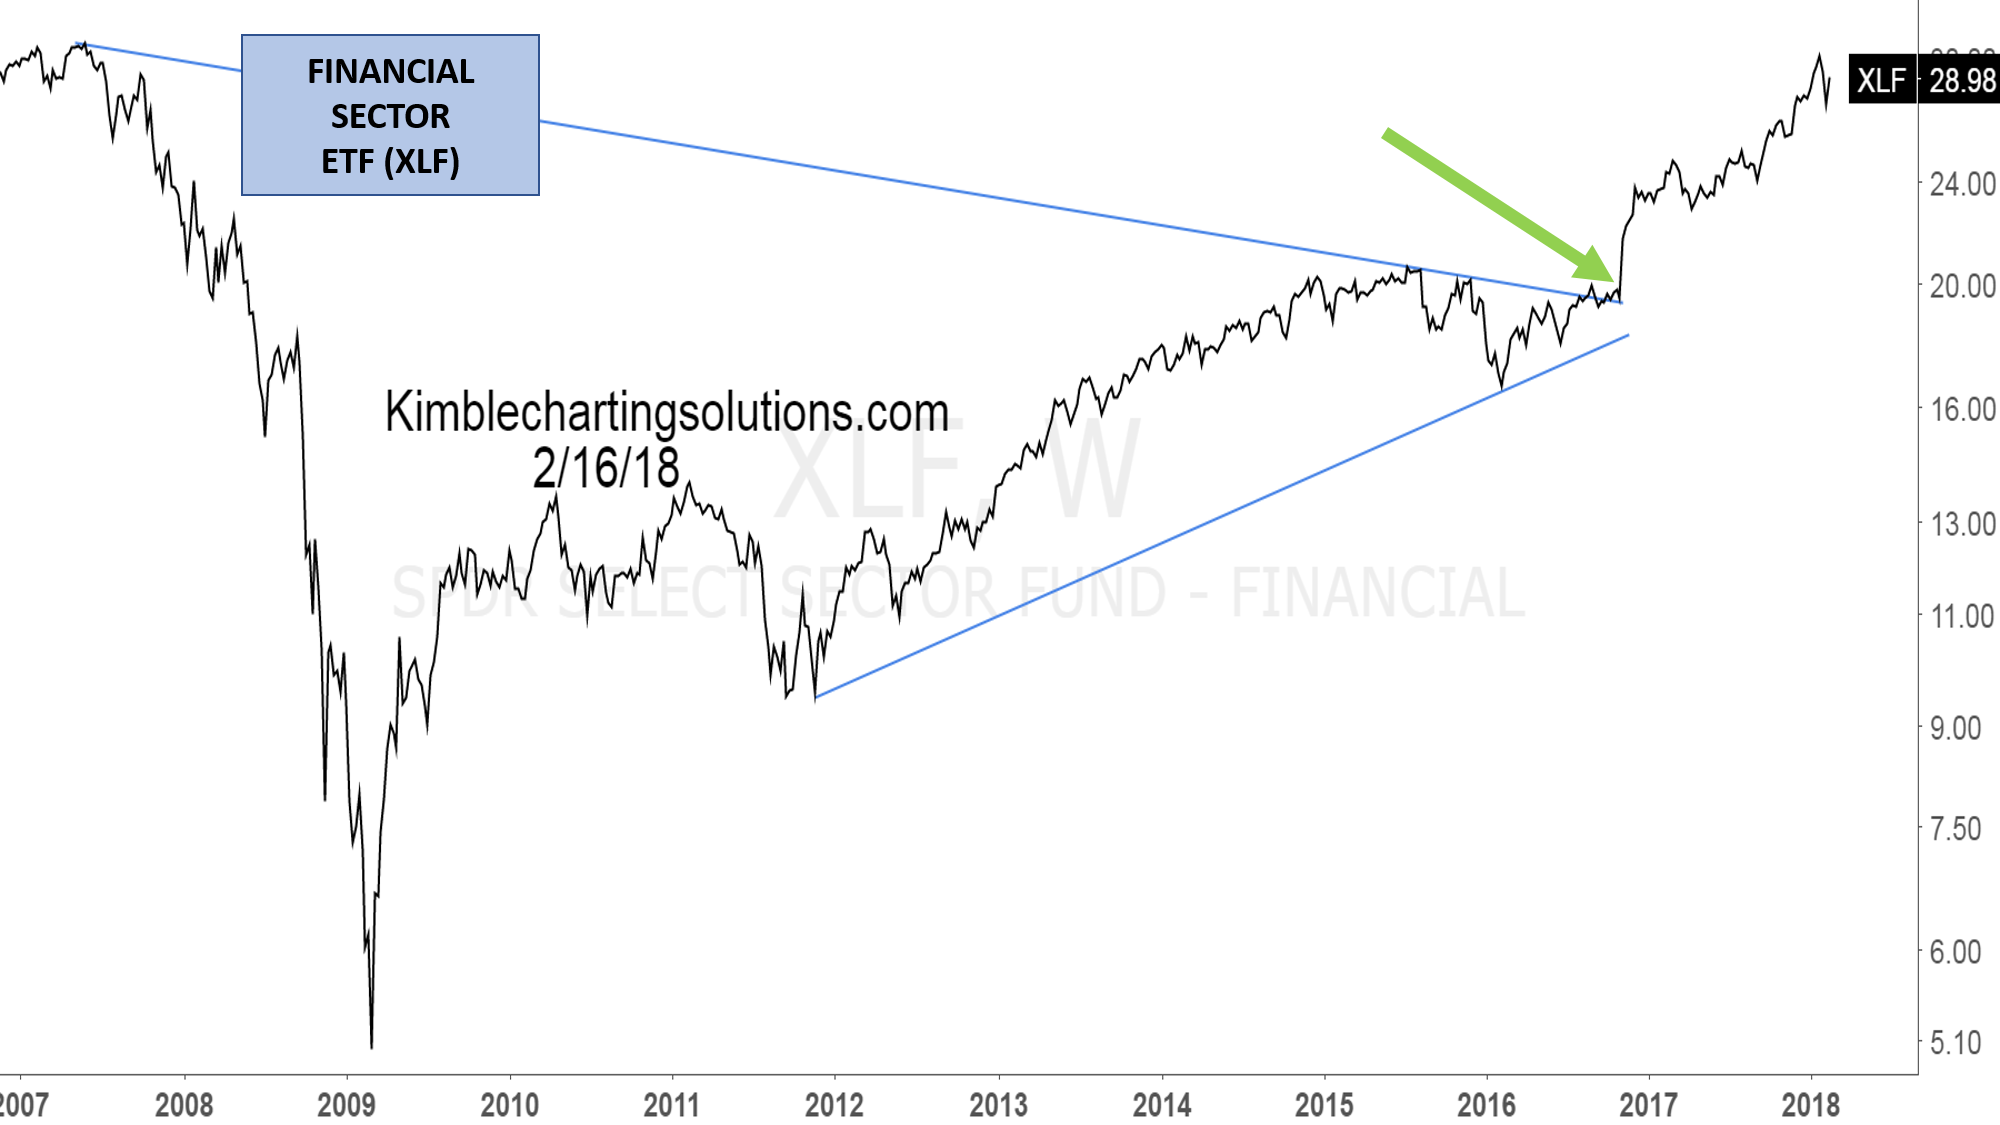
Charts are represented by a series of price points.
Charts form patterns over time, which provide a probability for an asset’s future direction.
Patterns also give us insight into the emotions of the buyers and sellers of an asset
Click Image to Enlarge
How Members Have Benefitted
1) A simple easy to understand approach
2) Clear information about each product and the opportunity to receive free updates to get a feel for what is offered and how it can be used
3) Results, I made profitable trades
Thanks and I look forward to learning with you
What I find most important about the research is the overall macro view of many different asset classes/sectors at the same time.
So in many cases just having the confidence in a market like SPY and NDX will help someone like me to ignore all of the noise and keep a simple approach.
It really often tells a concise story and raises great technical bullet points that I can share in client meetings.
I read it with great interest and immediately got out of my “risk on” government Thrift Savings account position and transitioned it 100% to the “risk off” “CASH position”. THANK you. Avoiding a 10% loss is almost like gaining 10%?
Future me, who retires earlier than my peers thanks you also.


