
For the past two years, the Russell 2000 and Value Line Geometric Indexes have been lagging.
Recently, however, both have come alive… adding a tailwind to the end of year rally.
BUT these short-term rallies may be in trouble. Which also could mean that the broad market rally is in trouble.
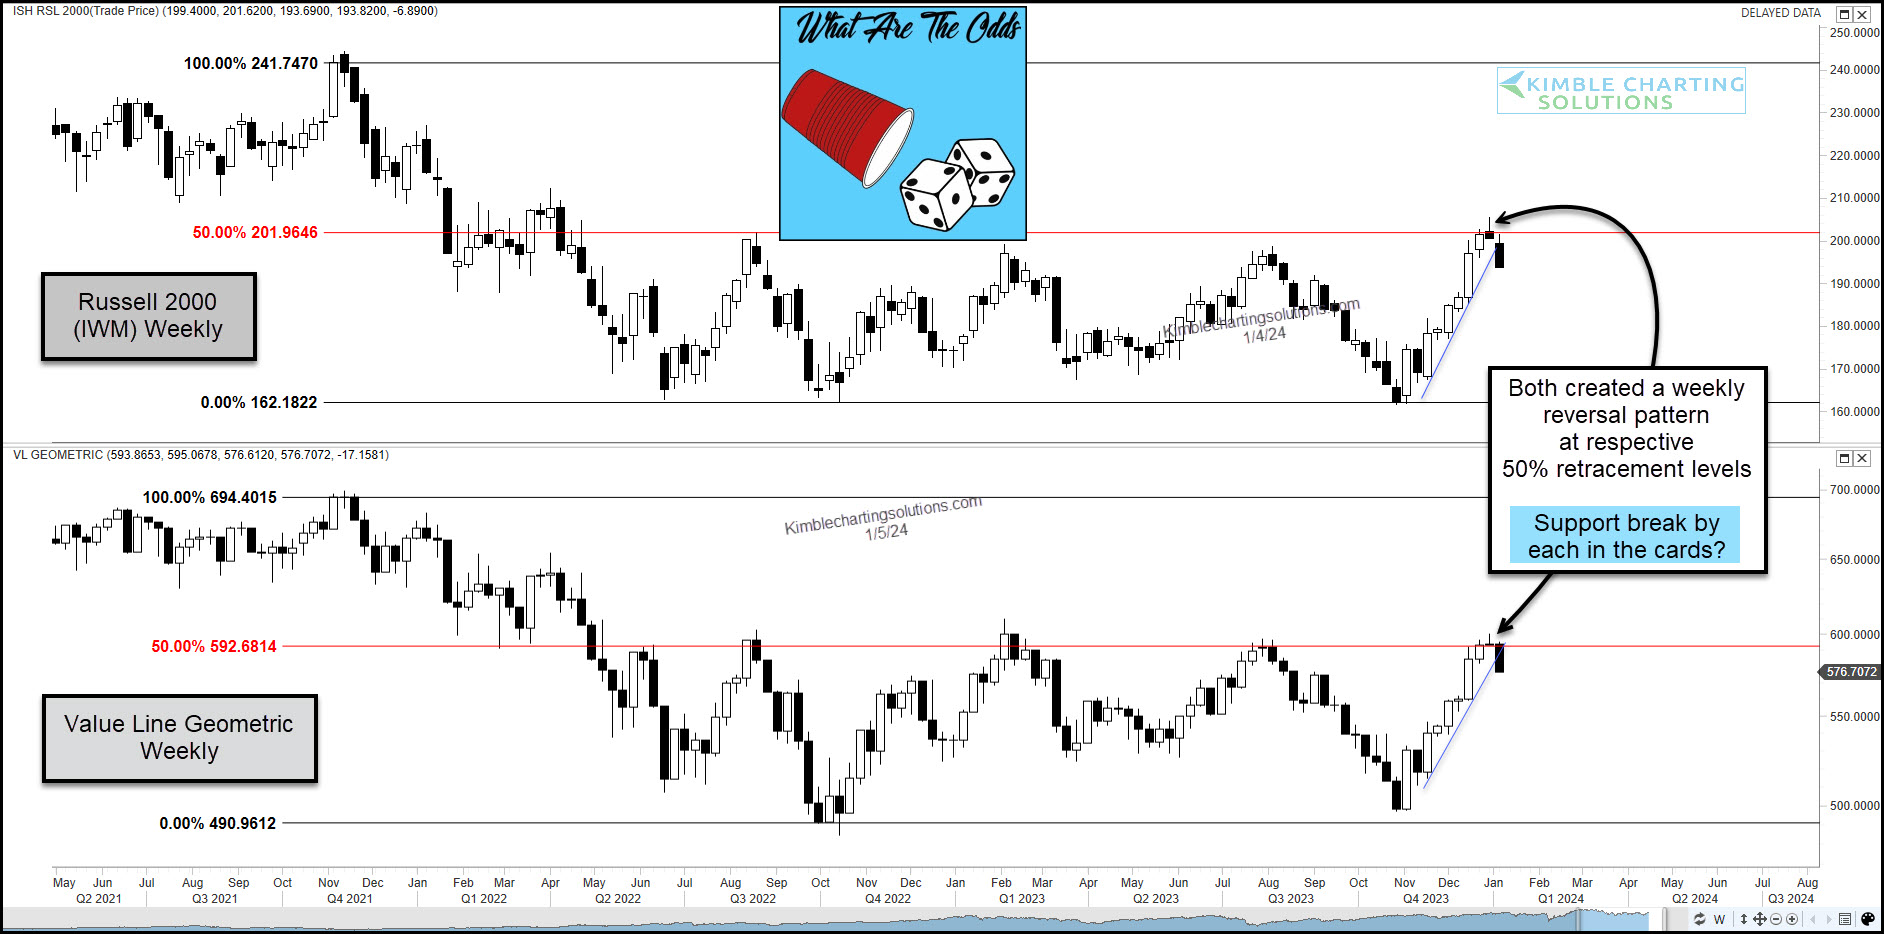
As you can see in today’s chart 2-pack, both of these lagging indices peaked at the respective 50% Fibonacci retracement level over the past two years. And it could be happening again.
Note that each index created a weekly reversal pattern over the past 2 weeks and are attempting to break down through up-trend support. Worth watching here, in my opinion.
Stock bulls would receive quite a bullish message if both break above the 50% levels at the same time!
This article was first written for See It Markets.com. To see the original post, CLICK HERE.
