by Chris Kimble | May 11, 2023 | Kimble Charting
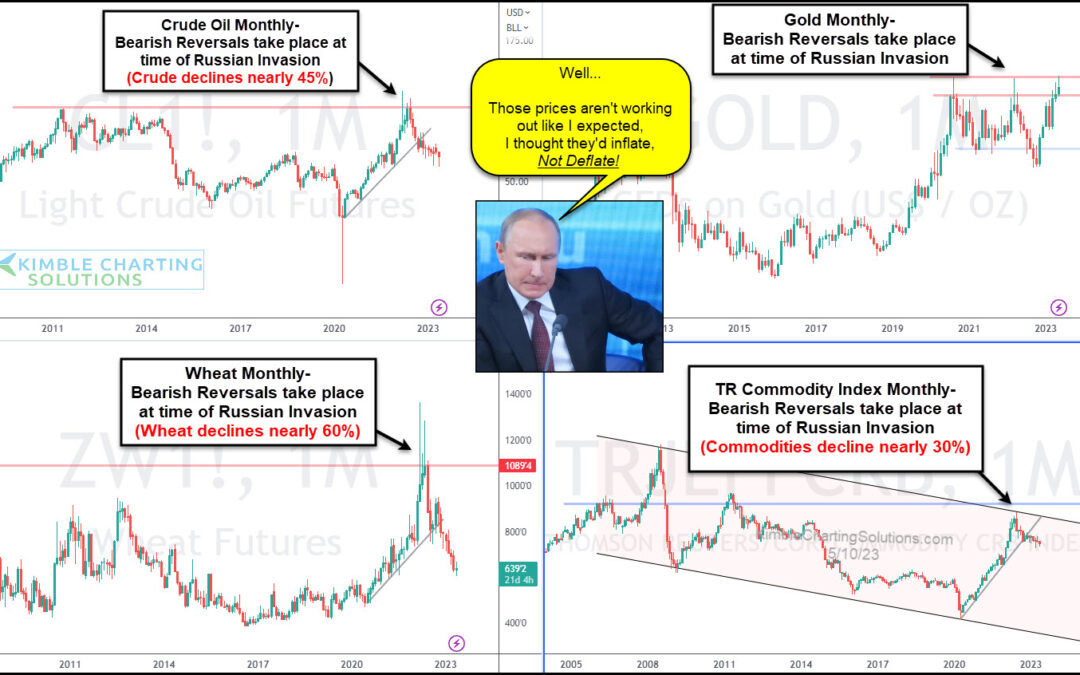
Market prices absorb all the information that’s out there. Perhaps that’s why several commodity prices surged in the months leading up to the Russian invasion of Ukraine. And since then, they have come back down to earth. I don’t think this is exactly how Putin...
by Chris Kimble | May 5, 2023 | Kimble Charting
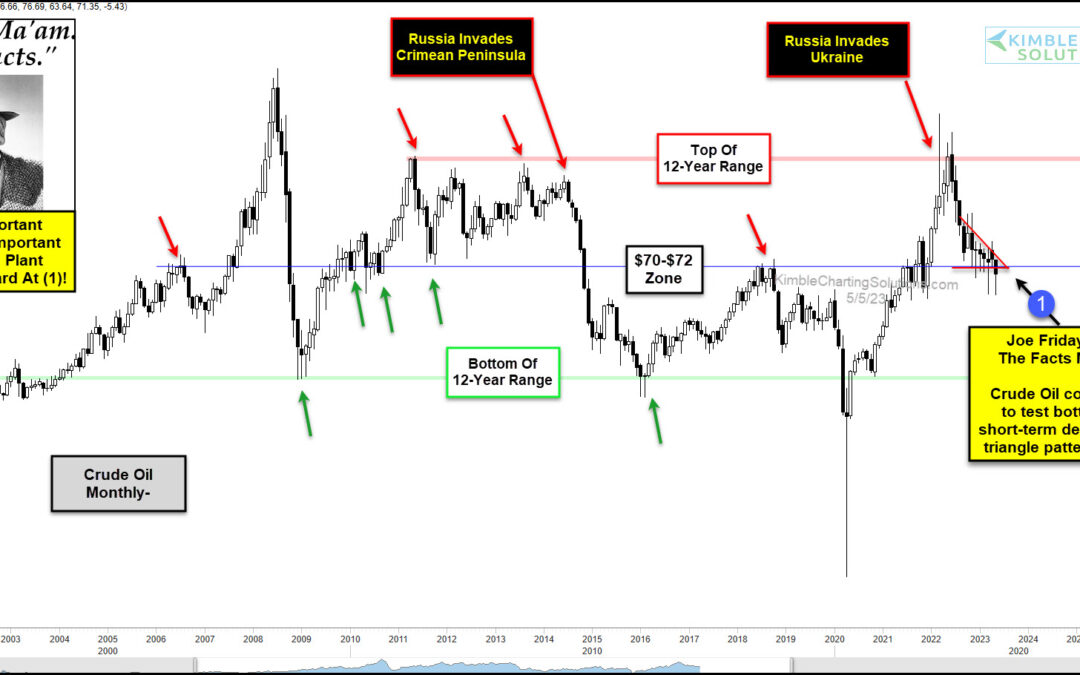
The past 12 years have seen some massive swings in the price of Crude oil. And the latest swing higher into 2022 played a role in higher gas prices and inflationary pressures. So how is the most important commodity in the world trading right now? Let’s turn to Joe...
by Chris Kimble | Apr 21, 2023 | Kimble Charting
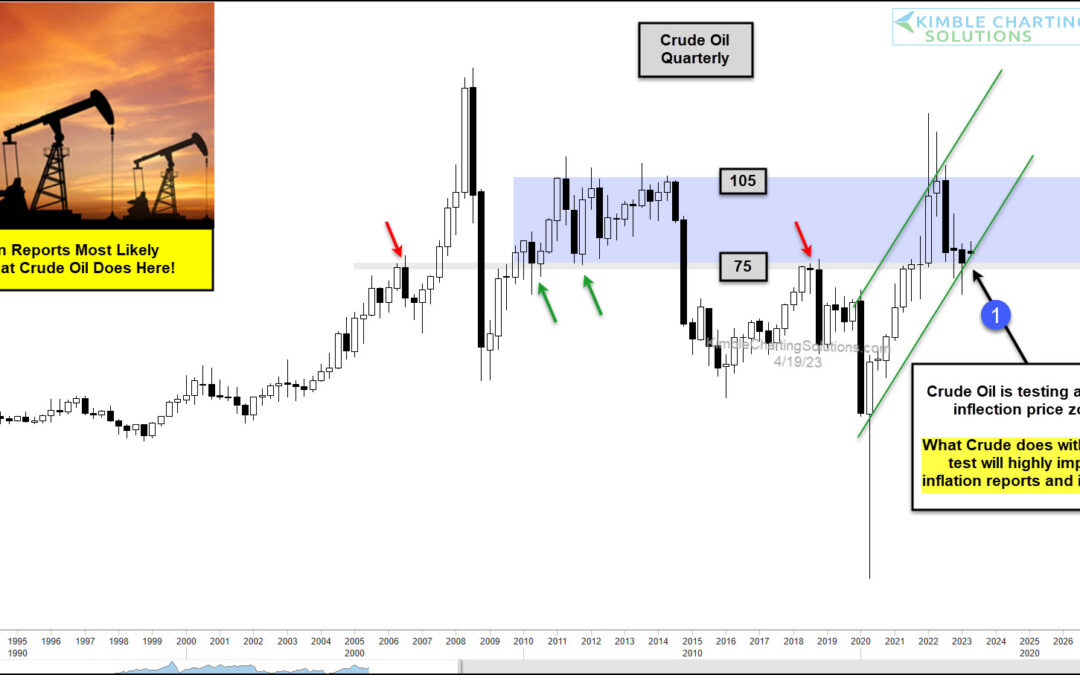
Inflation concerns peaked last year when agriculture and oil prices peaked. This year has seen inflation fears subside as key price inputs fall. BUT investors should not be complacent. Inflation risks remain. Today, we look at a “quarterly” chart of Crude Oil to...
by Chris Kimble | Jan 6, 2023 | Kimble Charting
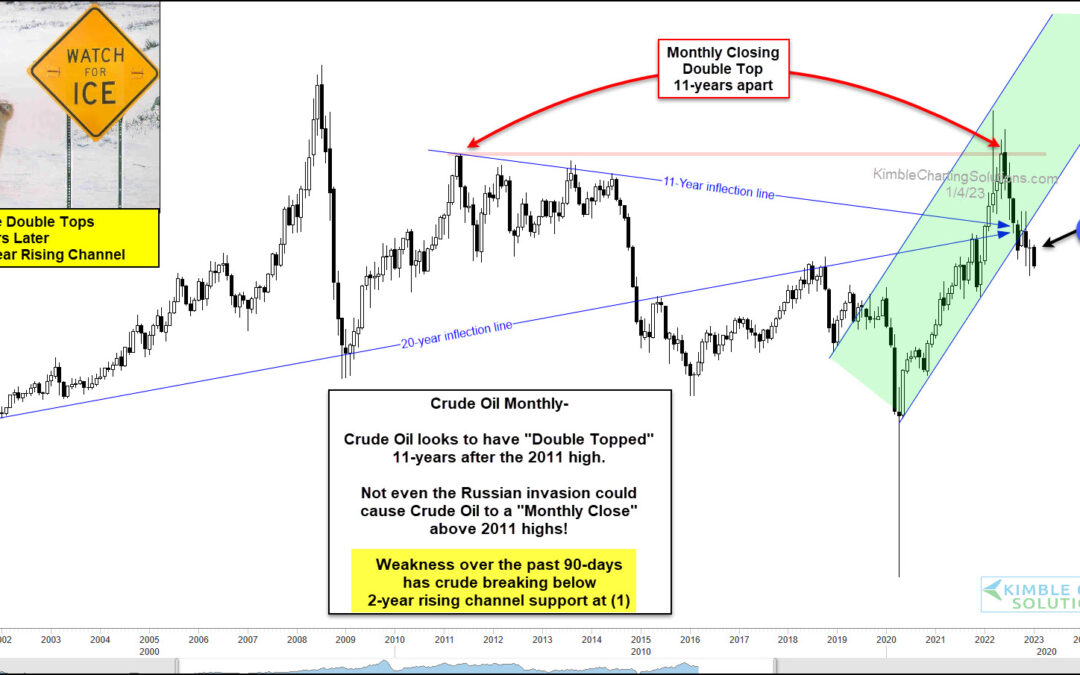
Oil prices surged on news of the Russian invasion, as investors knew the energy sector would be significantly effected by the war. But for how long? Looking at the “monthly” chart below of crude oil it appears “not for that long”. Note that we highlighted crude oil’s...
by Chris Kimble | Nov 23, 2022 | Kimble Charting
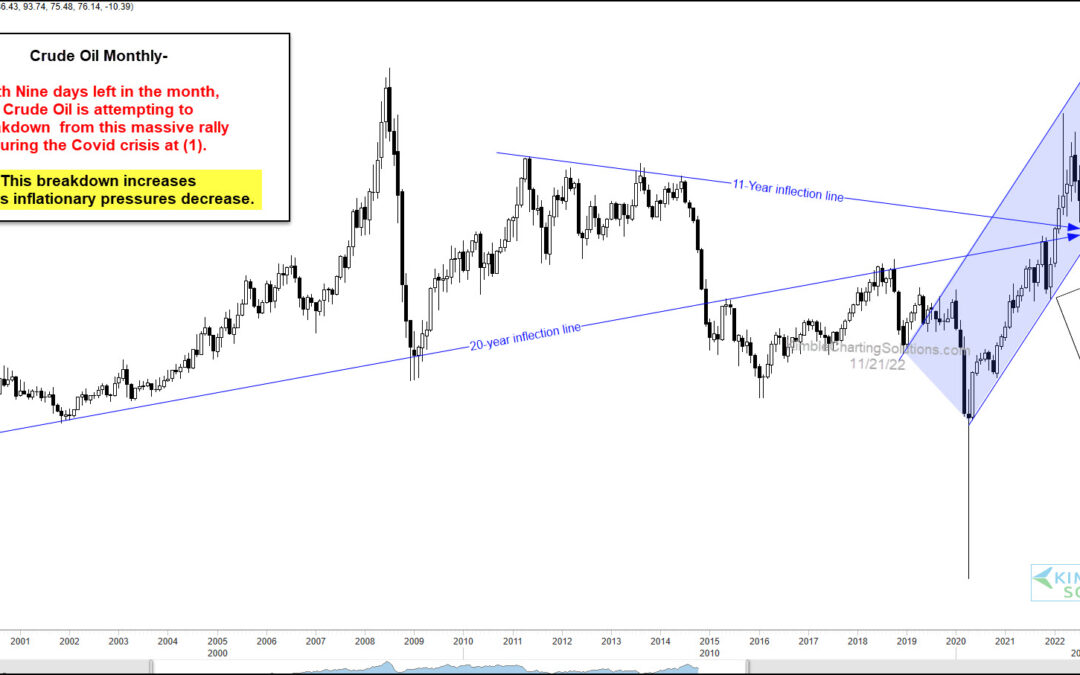
Crude oil prices rose sharply in 2022 and this has been a major factor in rising consumer prices and inflation. But the past five months have seen oil prices pull back… and this has been welcome news at the gas pump! With the holidays fast approaching, consumers are...
by Chris Kimble | Aug 22, 2022 | Kimble Charting
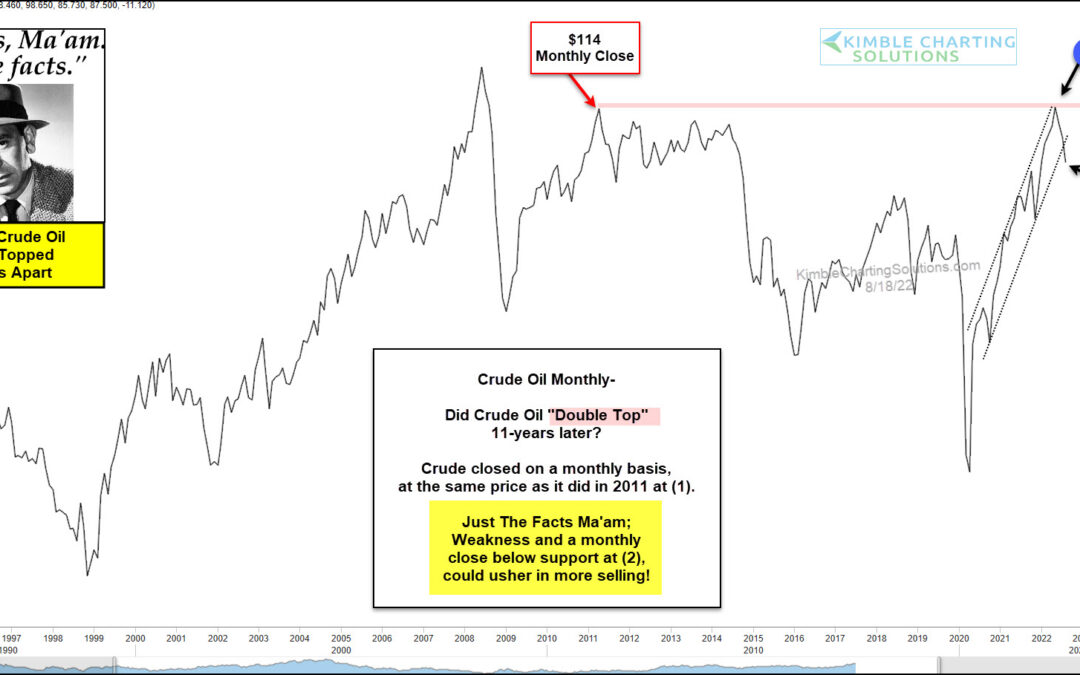
Consumers have taken notice to falling gas prices… and they like it. But will gas prices continue to fall? For that to happen, consumers (and investors) will need to pay close attention to crude oil prices (which have been falling lately)… And they should be aware a...
by Chris Kimble | Aug 2, 2022 | Kimble Charting
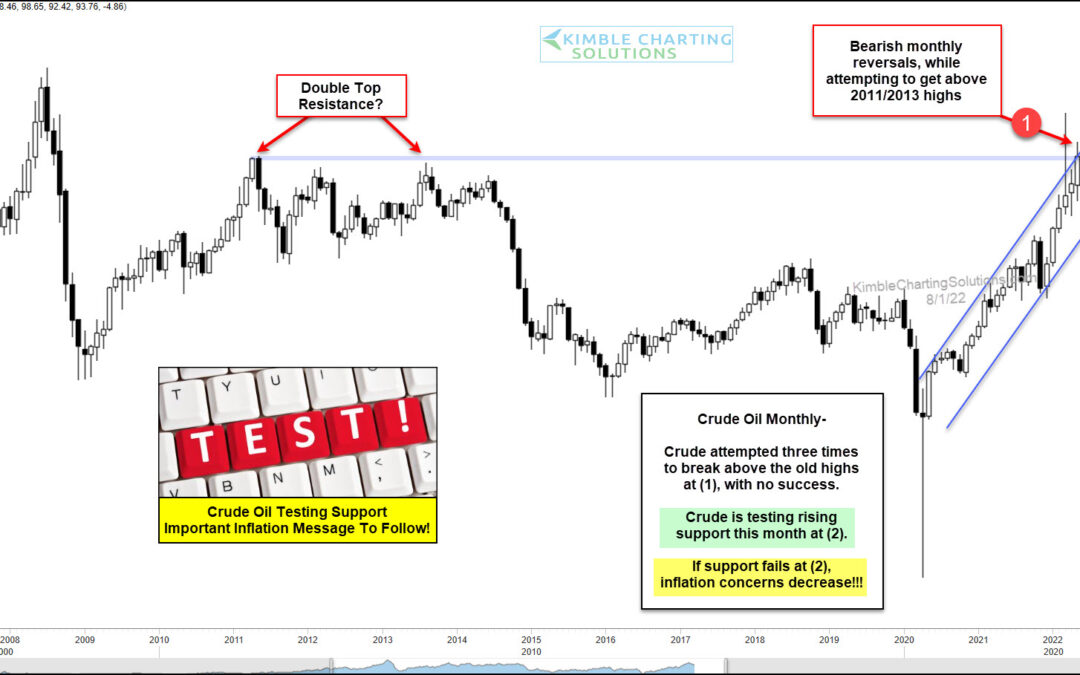
One of the most visible signs of inflation is gas prices. And, as you know, the price of gas is born out of the price of crude oil. Well, consumers have seen a small decline from the peak in gas prices earlier this year. But could prices fall much lower and further...
by Chris Kimble | Jun 24, 2022 | Kimble Charting
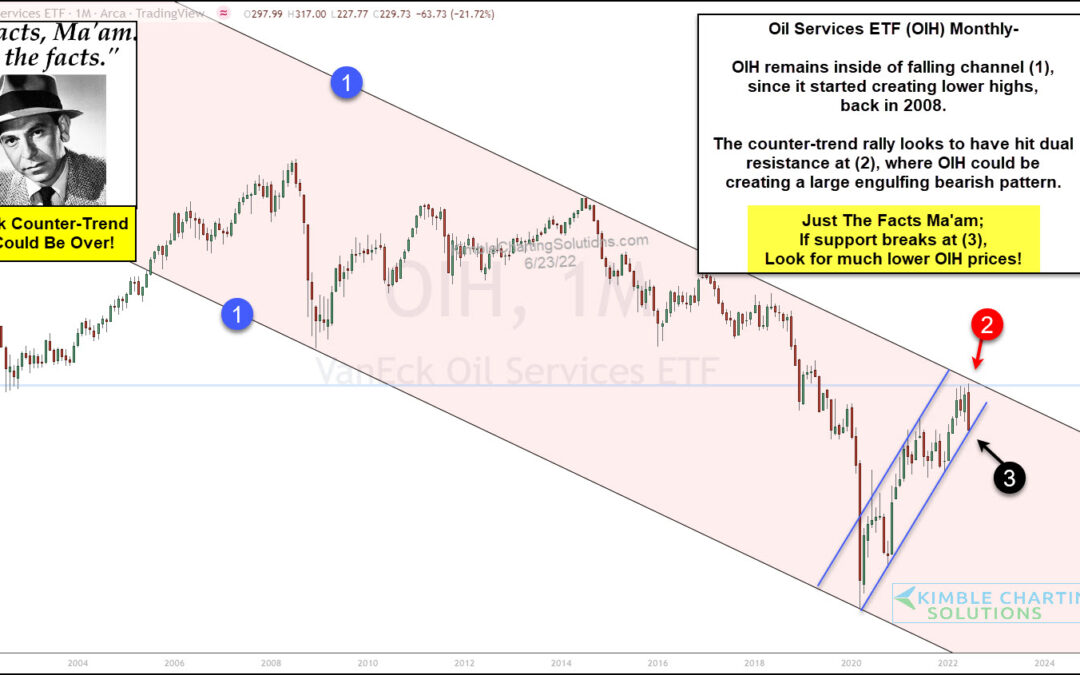
For over 2 years, all crude oil prices did was go higher… and higher. And consumers have been feeling this pain as the gas pump. Well, this month crude oil prices turned sharply lower joining the broad based commodities selloff. Could this be the start of a long...
