by Chris Kimble | Aug 24, 2022 | Kimble Charting
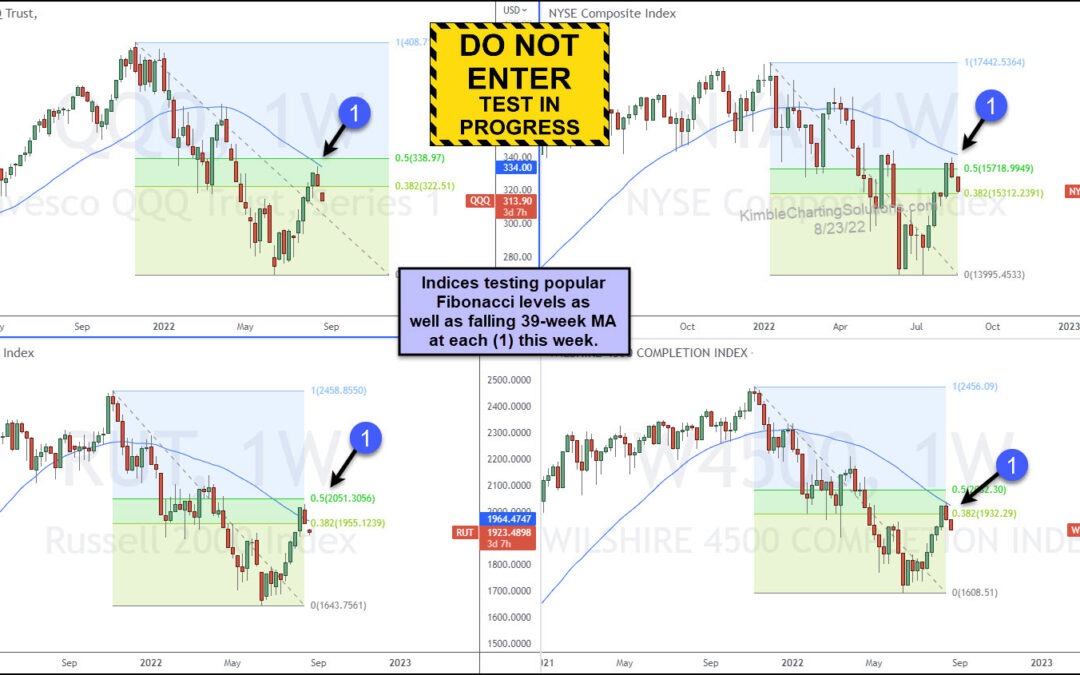
Several major U.S. stock market indices have bounced (rallied) over the past 2 months. But these moves higher are facing major test right now. And considering that we are in a bear market… these are just bounces until more constructive rallies take place with major...
by Chris Kimble | Dec 8, 2021 | Kimble Charting
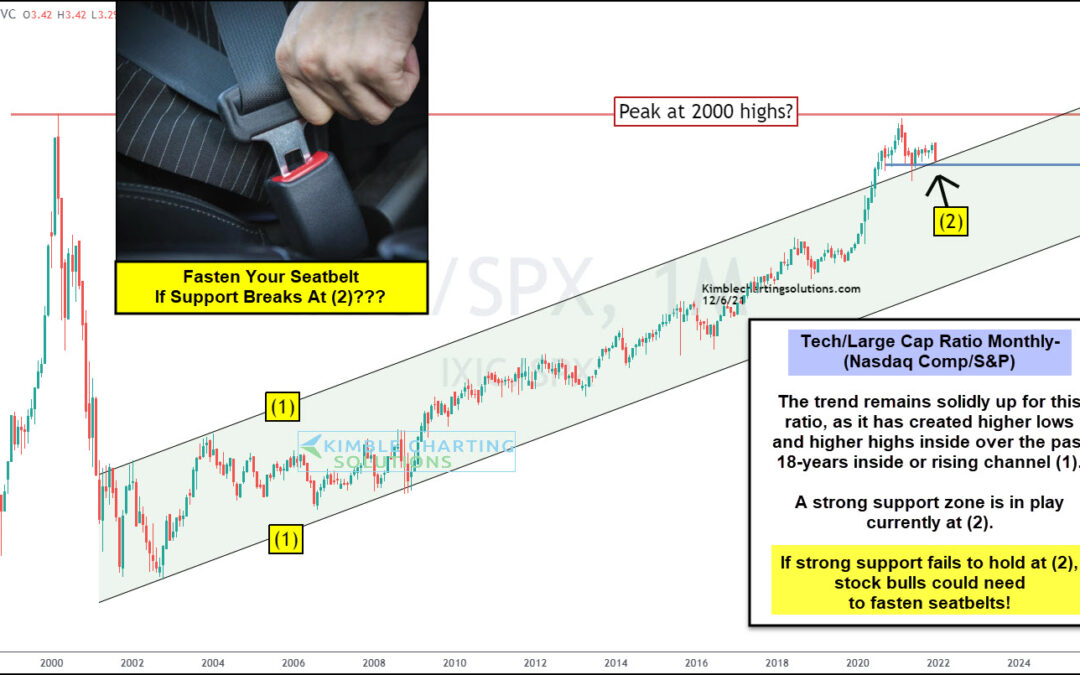
The U.S. economy and stock markets have been lead by technology companies (and stocks) for nearly 20 years. And this dynamic is on full display in today’s chart. Below is a long-term “monthly” ratio chart of the Nasdaq Composite to S&P 500 Index. In short, if this...
by Chris Kimble | Nov 11, 2020 | Kimble Charting
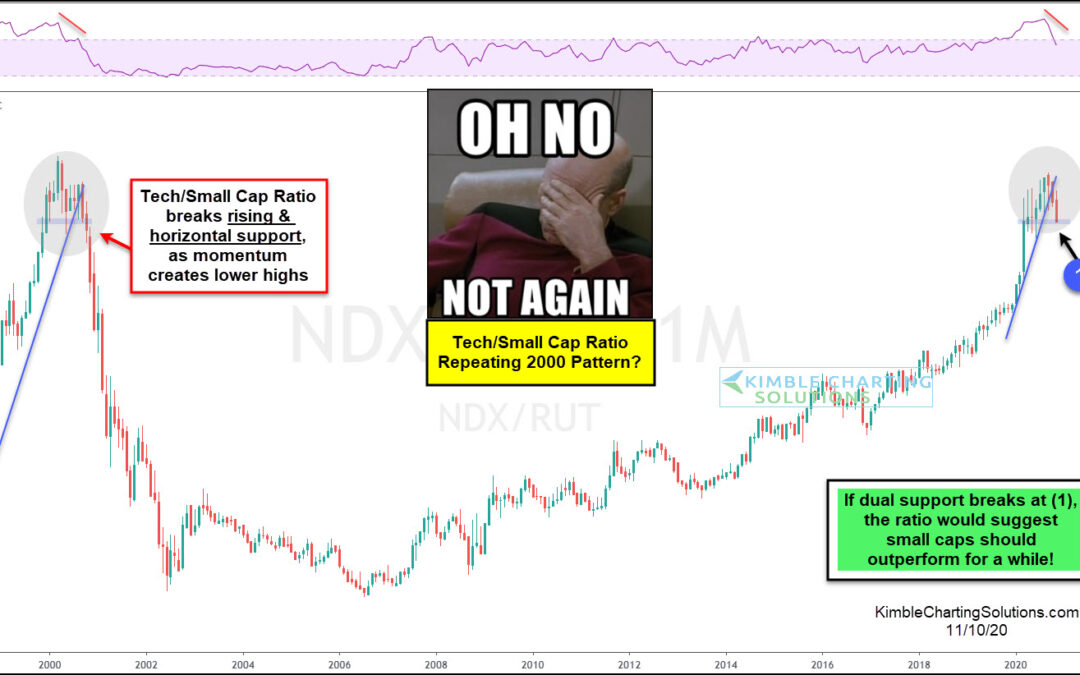
It’s always good to monitor the performance of market-leading sectors and indices. These leaders provide insight into the health of the bull market, potential trend changes, and/or the trend status of that particular sector or index. Today’s focus is on a long-term...
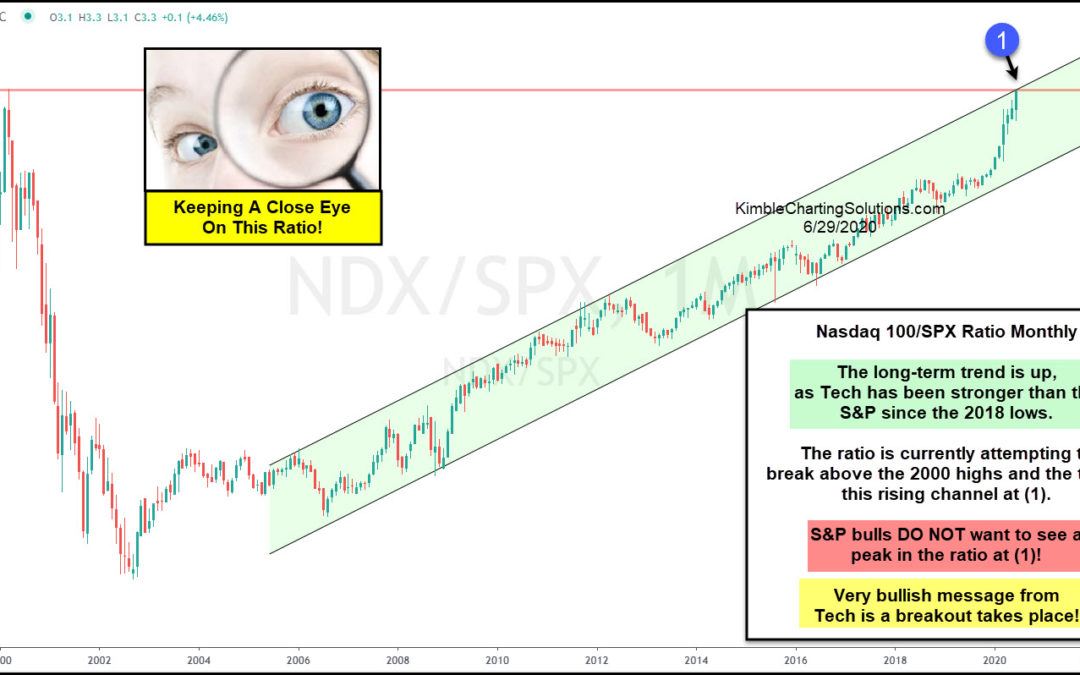
by Chris Kimble | Jul 16, 2020 | Kimble Charting
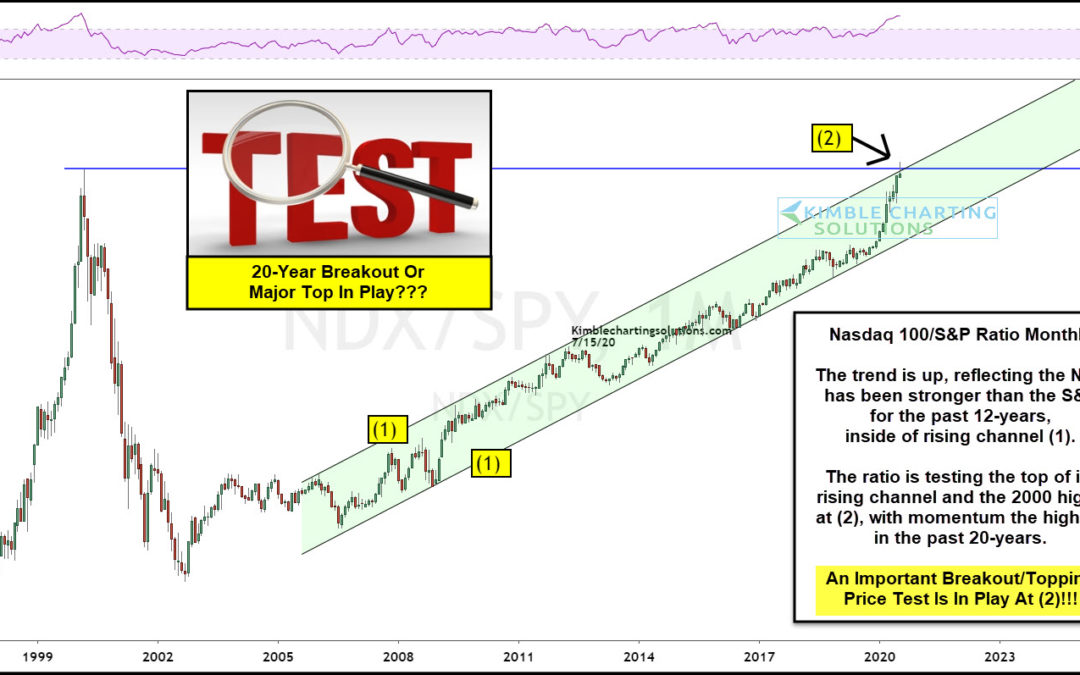
Is the latest ramp higher and Large-cap tech stocks have been the clear market leader, out-performing the broad market for months. In today’s chart, we look at the Nasdaq 100 to S&P 500 performance ratio in an effort to answer the question: Is the ramp higher in...
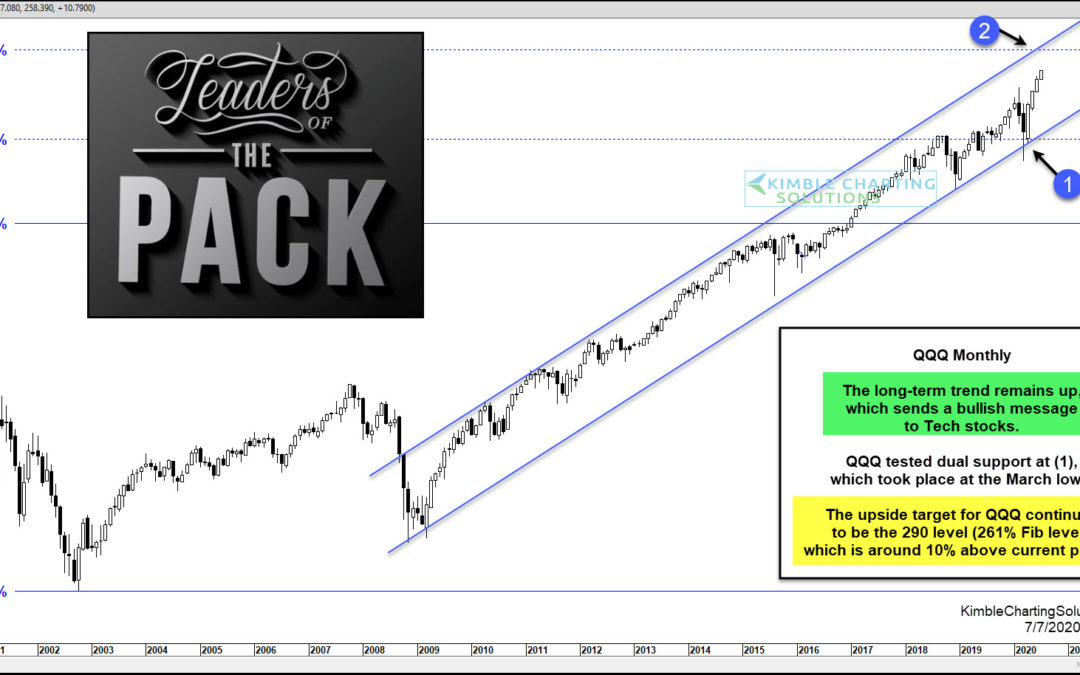
by Chris Kimble | Jul 7, 2020 | Kimble Charting
The long-term trend for large-cap tech stocks remains strongly in place. And despite the steep rally out of the March lows, the index may be headed 10 percent higher. Today’s chart highlights the $QQQ Nasdaq 100 ETF on a “monthly” basis. As you can see, the large-cap...
by Chris Kimble | Jul 2, 2020 | Kimble Charting
The tech bubble didn’t end well. BUT it did tell us that the world was shifting into the technology age… Since the Nasdaq 100 bottomed in 2002, the broader markets have turned over leadership to the technology sector. This can be seen in today’s chart, highlighting...
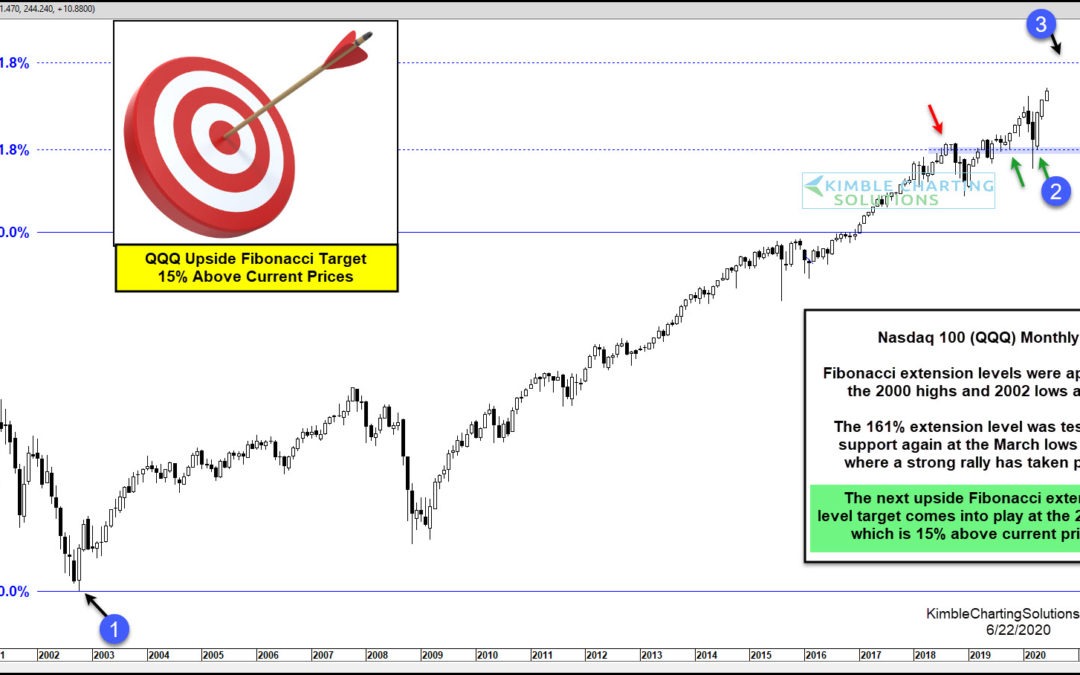
by Chris Kimble | Jun 23, 2020 | Kimble Charting
If one thing is true about this crazy bull market, it’s that technology stocks have been the clear leader (and winner). Even the coronavirus crash didn’t knock out the tech sector. The Nasdaq Composite and Nasdaq 100 have come racing back and are the only major US...
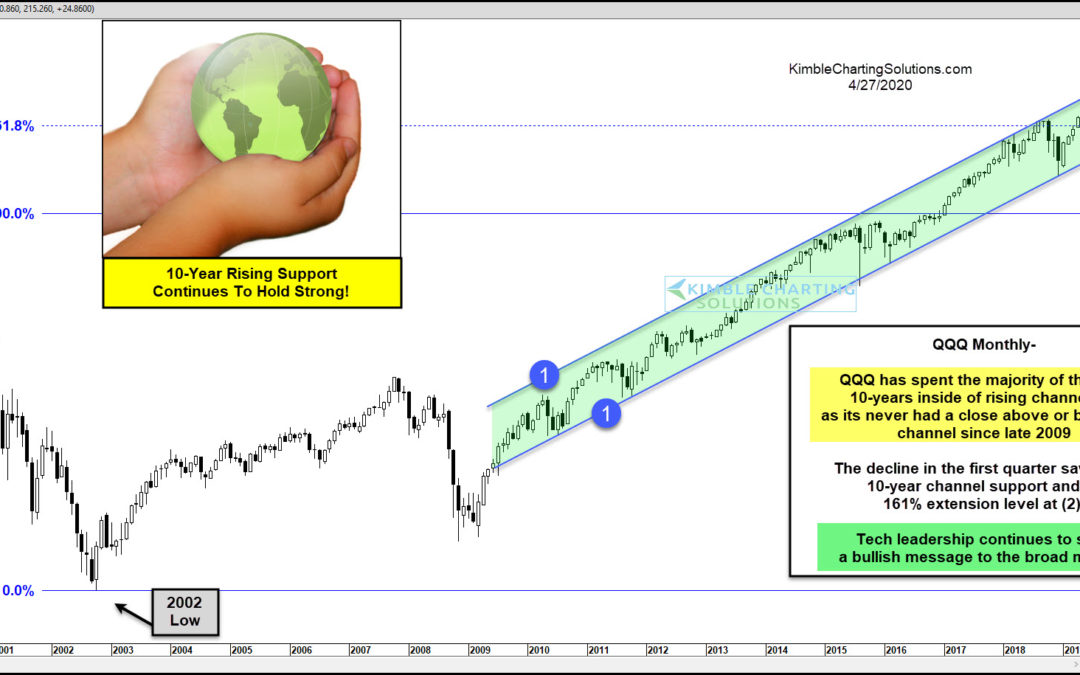
by Chris Kimble | Apr 28, 2020 | Kimble Charting
The stock market crash was a scary event and the future still holds plenty of uncertainty. But today’s chart provides some hope. The Nasdaq 100 ETF (QQQ) represents large-cap tech stocks, an area that has been a leader of the bull market run off the 2009 lows. As you...
