by Chris Kimble | Jul 16, 2024 | Kimble Charting
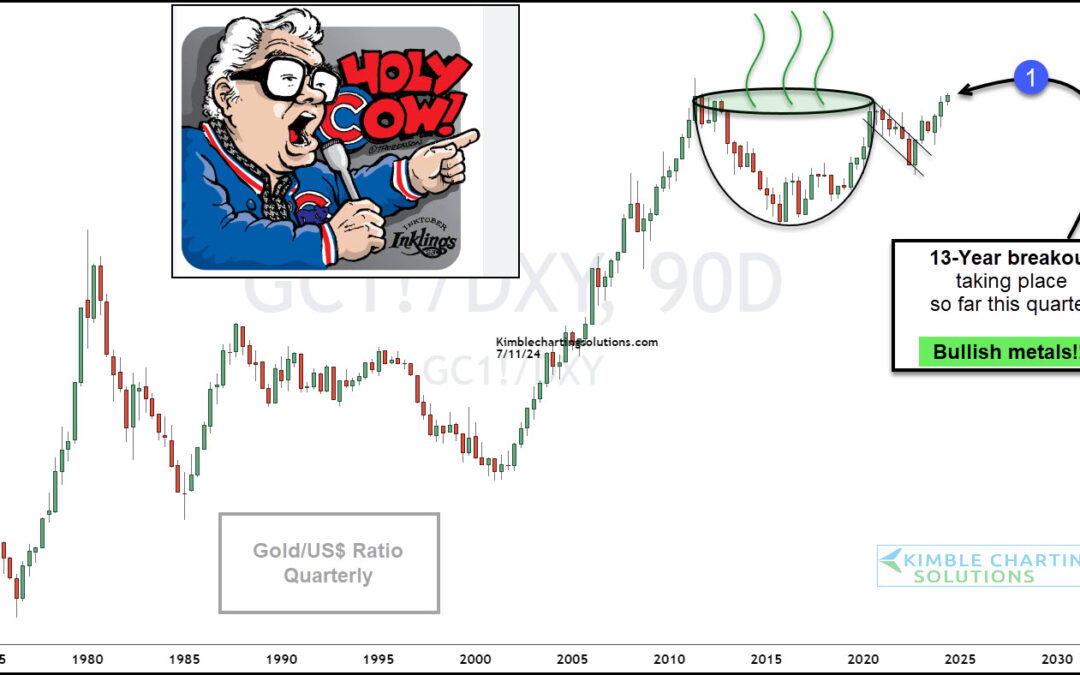
Precious metals continue to show strength this year with Gold breaking out to new all-time highs. Could things get even more bullish for Gold? Well, today’s chart highlights a key precious metals ratio that is working on a 13-year breakout. Below is a long-term chart...
by Chris Kimble | May 22, 2024 | Kimble Charting
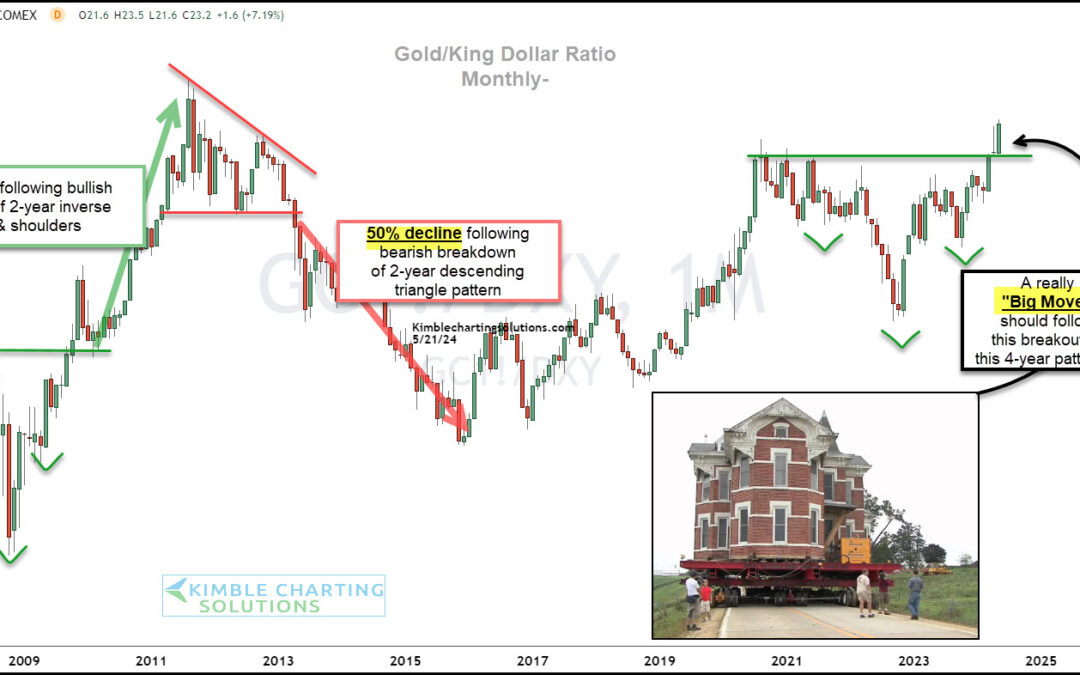
2024 has been filled with headlines about stock market highs and stocks such as Nvidia. But one major asset and commodity that is making an historic rally is Gold. This comes after a long, boring sideways move with a lot of ups and downs… so it’s understandable why...
by Chris Kimble | Apr 15, 2024 | Kimble Charting
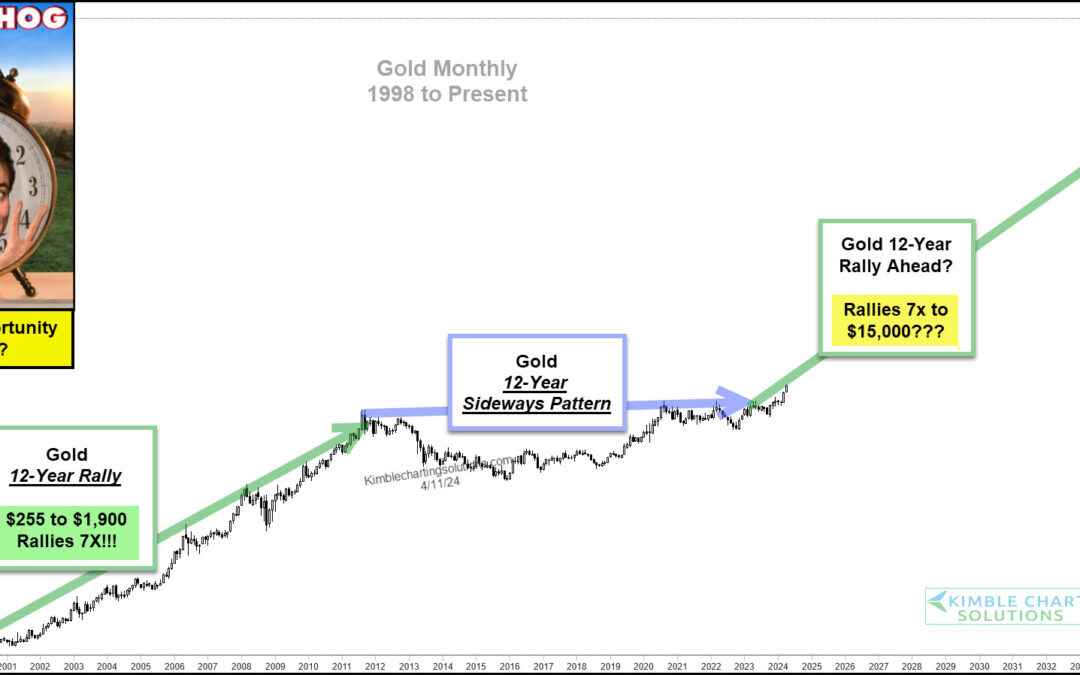
Gold spent the better part of the past 12 years trading in a broad sideways pattern. This type of price action tends to drive away speculators (and even some convicted bulls). It also meant gold wasn’t getting many “sexy” headlines as investors weren’t overly bullish....
by Chris Kimble | Apr 12, 2024 | Kimble Charting
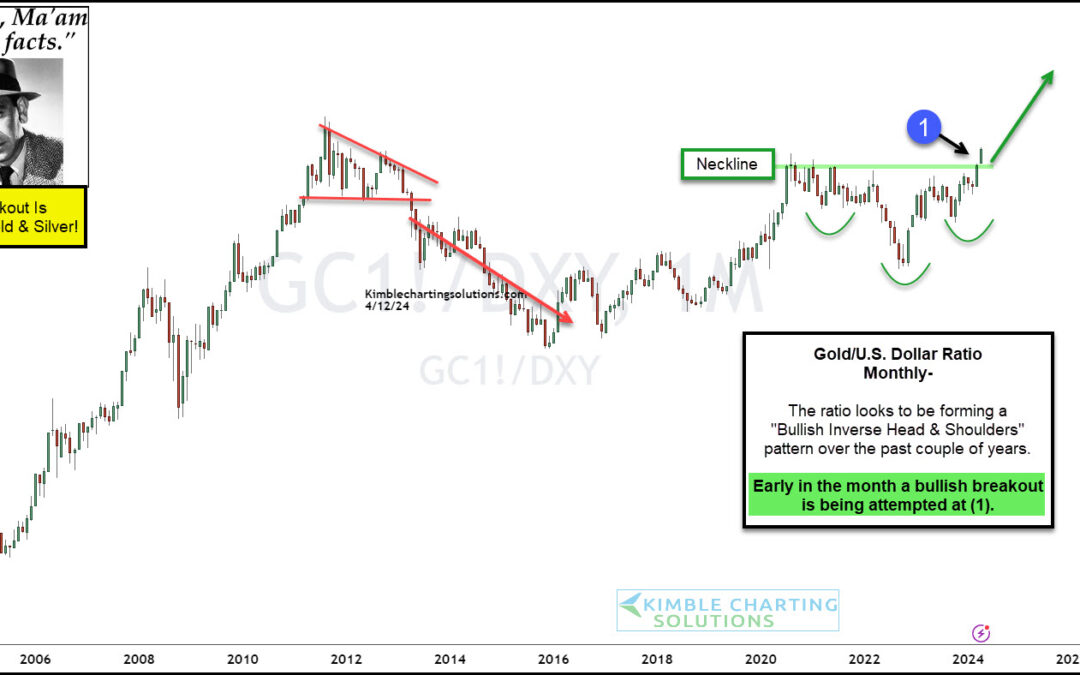
I have spent a lot of time discussing the bullish implications of Gold price patterns and the recent Gold breakout attempt. So why not offer up yet another example of why Gold (and precious metals partner, Silver) are brimming with bullish possibilities. For...
by Chris Kimble | Mar 8, 2024 | Kimble Charting
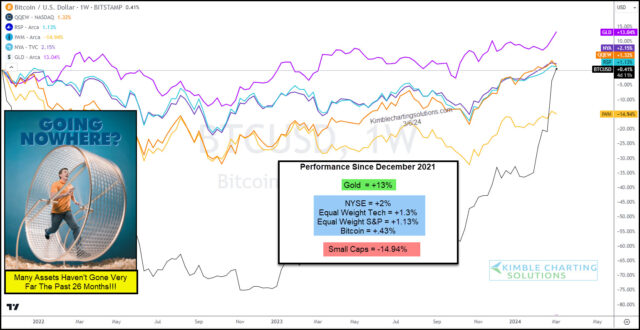
Several indicators of investor sentiment are showing rising “greed” levels. And when investors get greedy, it tends to imply that we are nearing a top. BUT, I am unsure why greed levels are so high when so many assets have little to brag about over the past few years!...
by Chris Kimble | Mar 5, 2024 | Kimble Charting
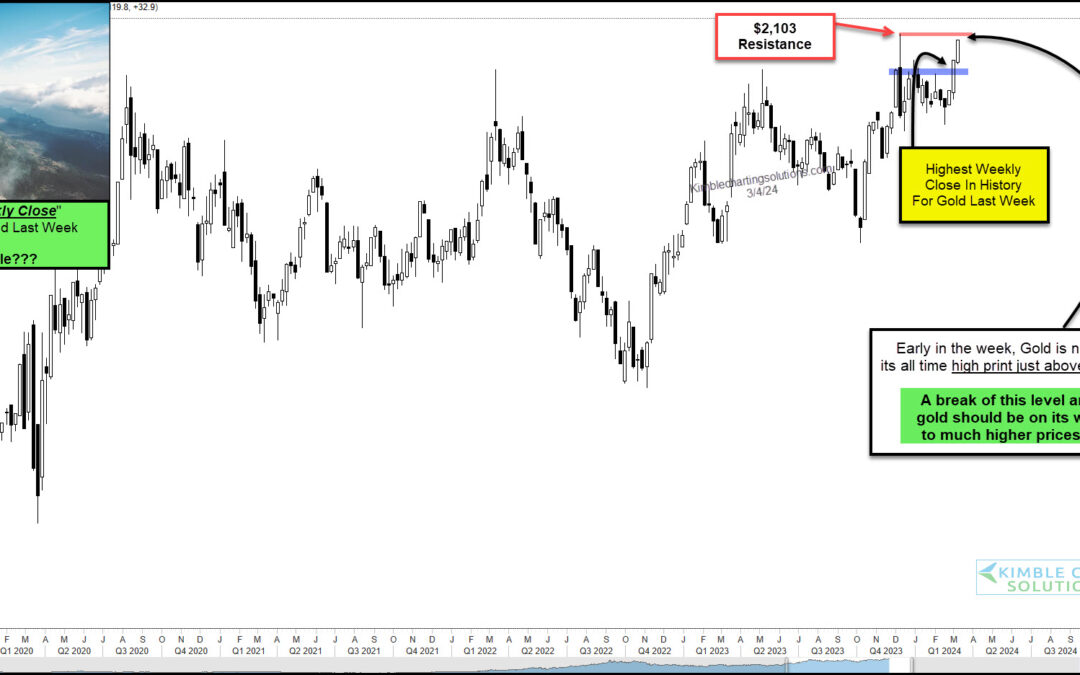
Precious metals may finally be nearing the rally that gold and silver bulls have been waiting for. Today, we simply focus on Gold from a “weekly” price perspective. And let’s just say that the recent price action has been bullish. Last week, Gold closed at its...
by Chris Kimble | Feb 13, 2024 | Kimble Charting
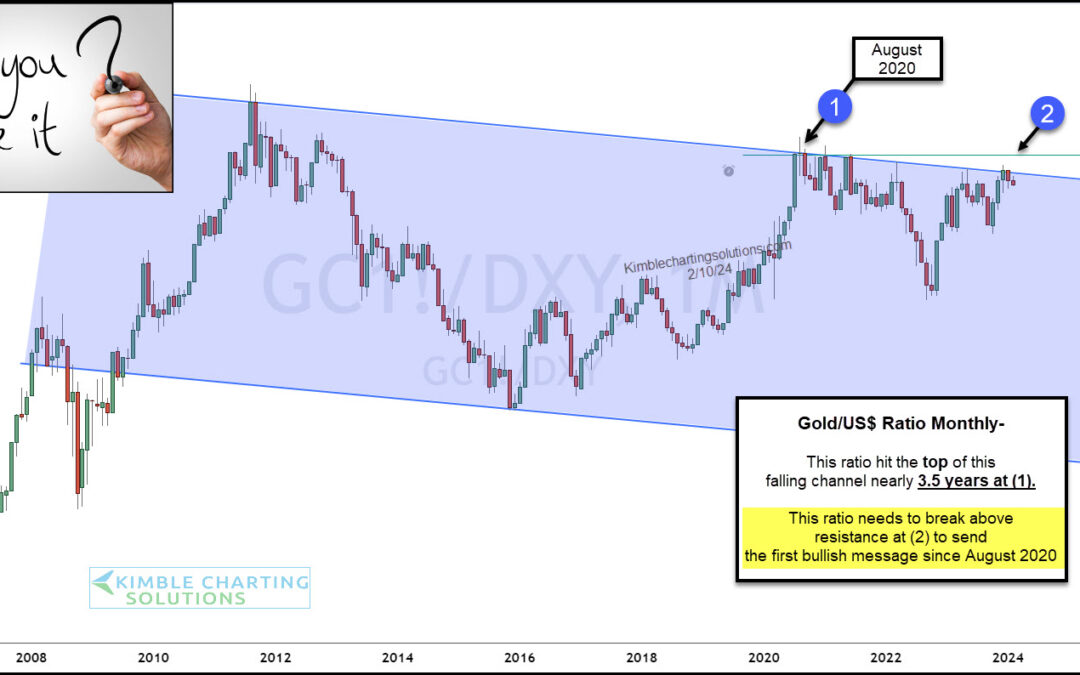
Gold prices remain elevated but have yet to record the major breakout that gold bulls are looking for. Today, we revisit an important Gold ratio that we have been following for months: the Gold to U.S. Dollar ratio. And above, you can see why. The long-term “monthly”...
by Chris Kimble | Dec 27, 2023 | Kimble Charting
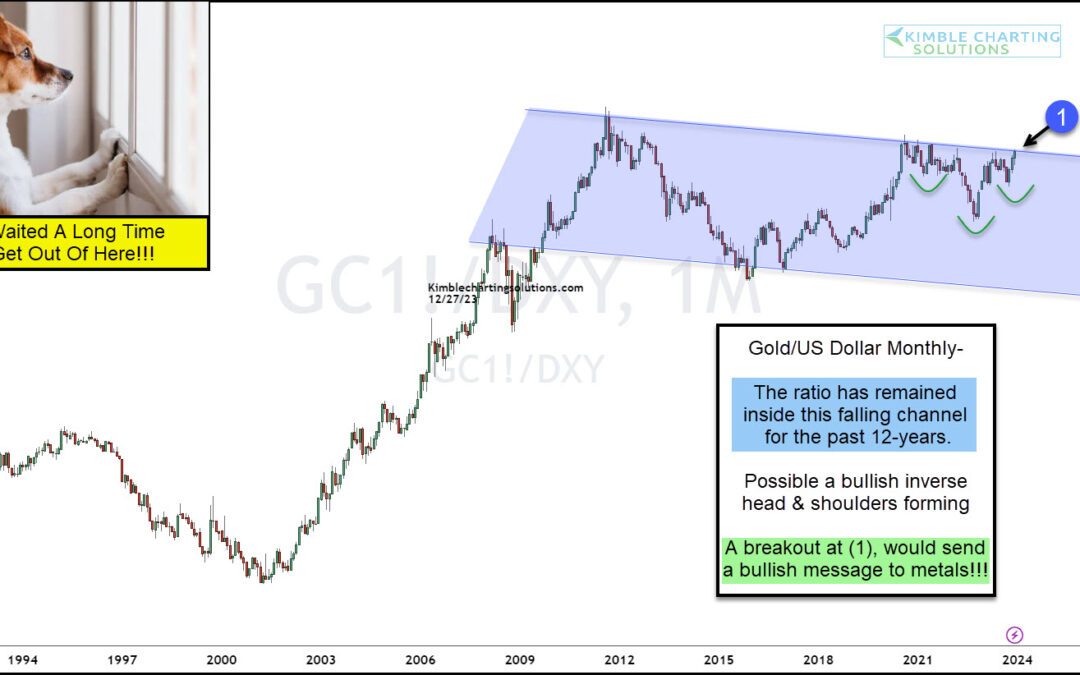
Precious Metals have been strong this month and have metal heads excited for next year. One gauge that I use to highlight the strength of Gold is the ratio of the price of an ounce of Gold to the US Dollar Index. And today’s chart shows why we could be at a critical...
