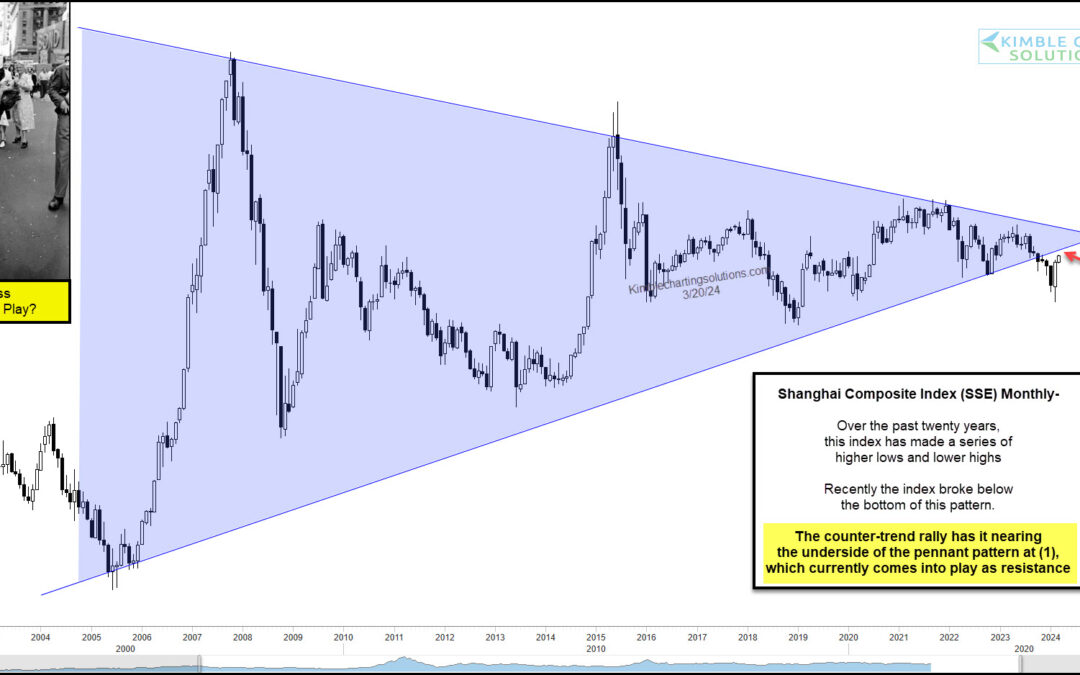
by Chris Kimble | Mar 22, 2024 | Kimble Charting
When the Chinese economy or stock markets are signaling an important turn or good/bad signal, the rest of the world needs to listen. Today, we look at a long-term chart of the important Chinese stock market index, the Shanghai Stock Exchange Composite (SSEC). Could...
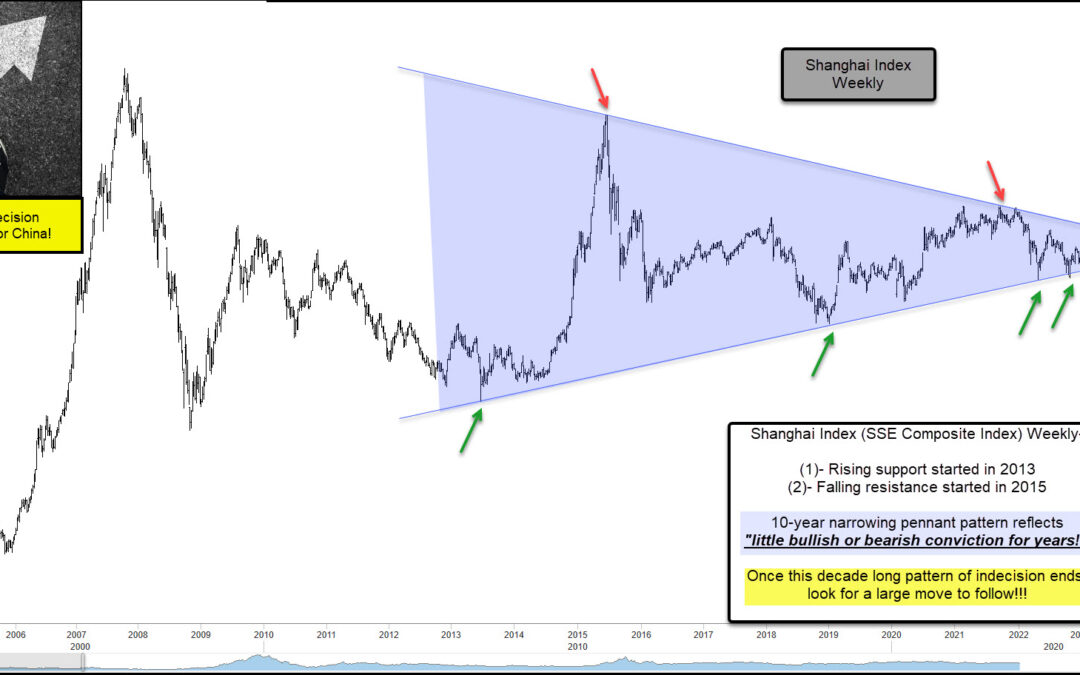
by Chris Kimble | Aug 28, 2023 | Kimble Charting
China has the world’s largest population and second largest economy, so it’s always wise to keep an eye on the Chinese economy and stock market. Today we look at the latter, eyeing up a 10-year indecision pennant pattern on the Shanghai Composite Index. As you can...
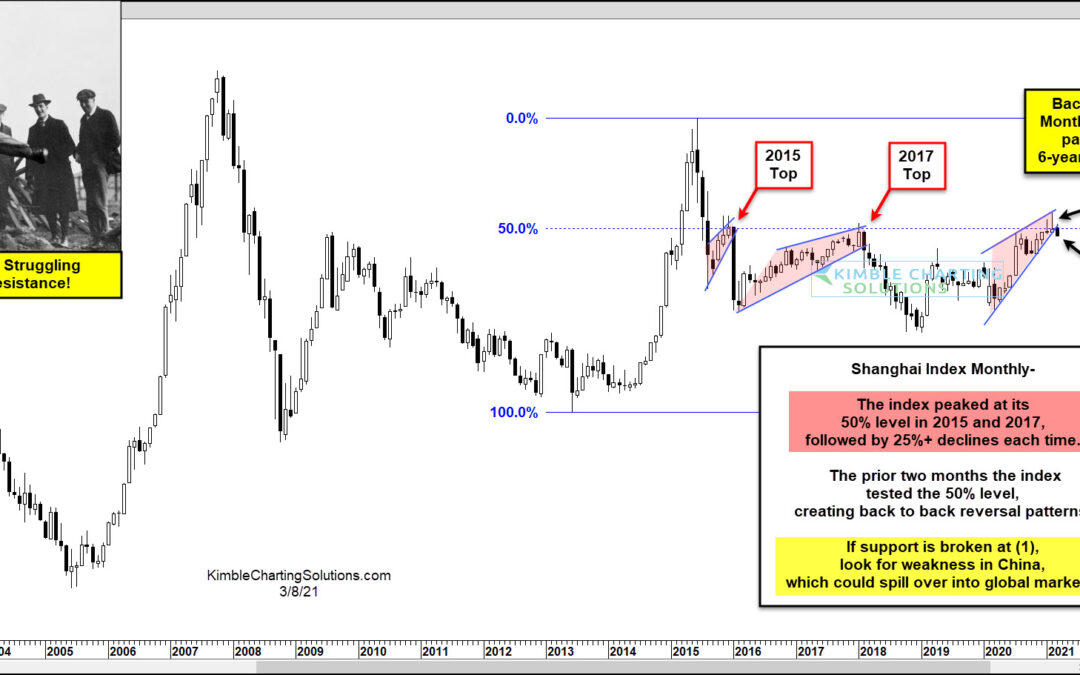
by Chris Kimble | Mar 8, 2021 | Kimble Charting
Could China be sending an important message to stocks around the world? Very possible! This chart looks at the Shangai Index on a monthly basis since the early 2000s. The index has peaked twice in the past 6-yeas at its 50% Fibonacci retracement level. These peaks...
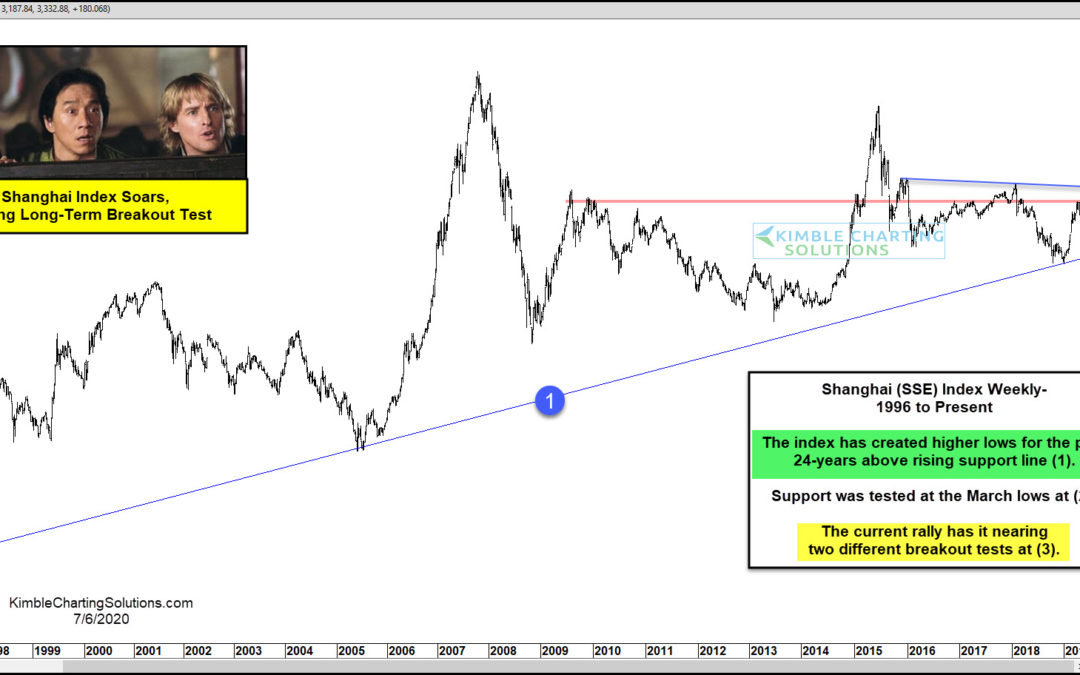
by Chris Kimble | Jul 6, 2020 | Kimble Charting
Is the Shanghai Index (SSE) about to experience a long-term breakout and send the world a bullish message? An 11-year breakout test is in play that will answer this question. The Shanghai index trend continues to send a bullish message, as it has created a series of...
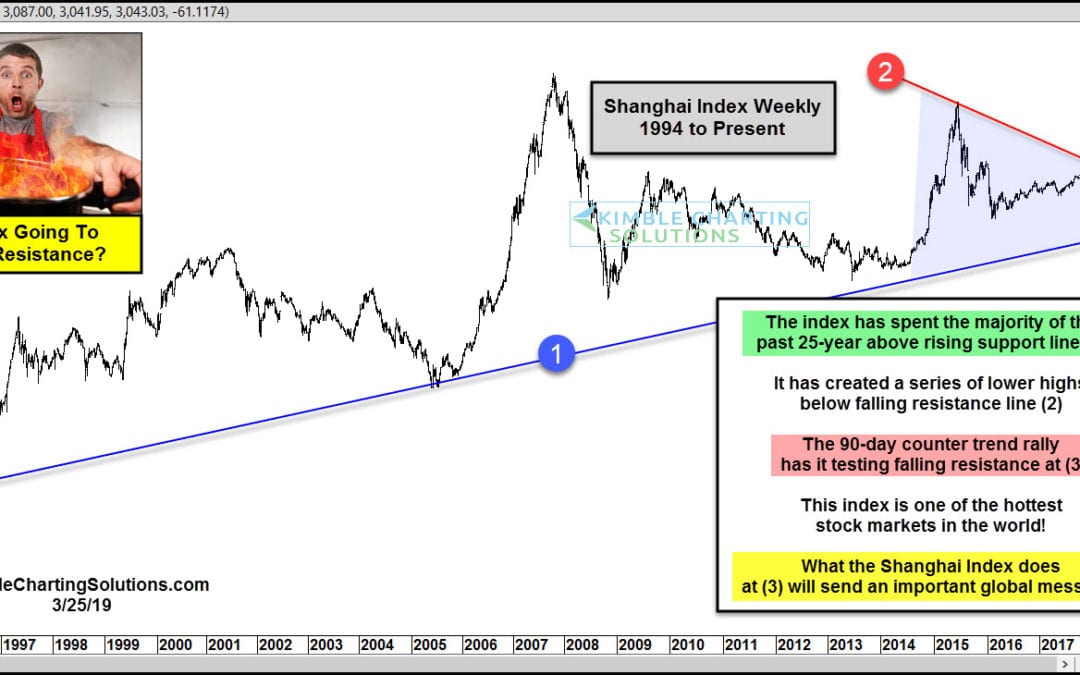
by Chris Kimble | Mar 25, 2019 | Kimble Charting
Is one of the hottest stock indices in the world about to peak? Possible. The S&P is off to a great start this year, up over 12%. Yet the Shanghai index is white hot, up around 22%, almost twice as much as the S&P 500! This chart looks at the Shanghai Index...

by Chris Kimble | Feb 7, 2018 | Kimble Charting
Below looks at the Nikkei Index from Japan and the Shanghai Index from China. Let me make this point right off the bat-“Both” markets at this time are in rising trends. Below looks at the Nikkei Index on a monthly basis over the past 30-years- CLICK ON...

by Chris Kimble | Jul 27, 2015 | Kimble Charting
CLICK ON CHART TO ENLARGE It could pay to be “aware of these surroundings!” (1) – Nasdaq Composite Index is back at 2000 highs, with little wiggle room at the top of this rising wedge pattern (2) – Google shot up after earnings two weeks ago...

by Chris Kimble | Jul 13, 2015 | Kimble Charting
Investors and the media seemed to be consumed with the news from Greece of late. Could they be looking the wrong direction? Humbly I feel its important to watch the Dax-hai indictor. What is the Dax-hai indicator? Its the combination of the the DAX Index (Germany) and...
