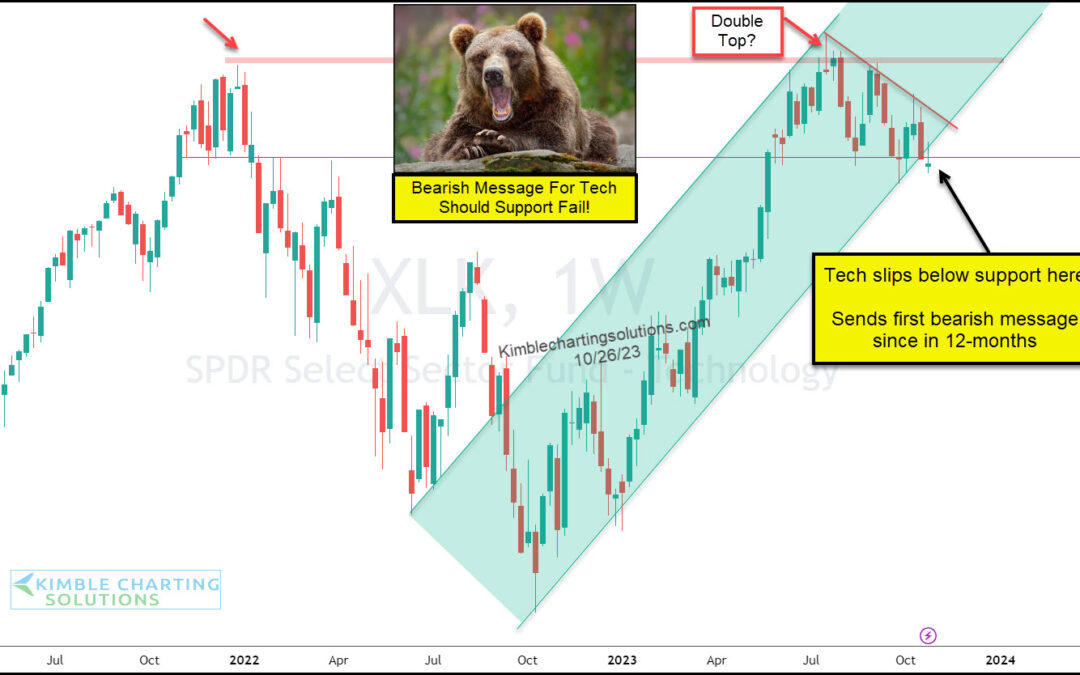
by Chris Kimble | Oct 27, 2023 | Kimble Charting
Today’s technology stocks make the world run. The tech sector and select large cap stocks have lead the broader bull market for nearly 14 years. So when they are weak, investors should take note! Today’s chart takes a “weekly” view of the S&P Technology Sector ETF...
by Chris Kimble | May 24, 2023 | Kimble Charting
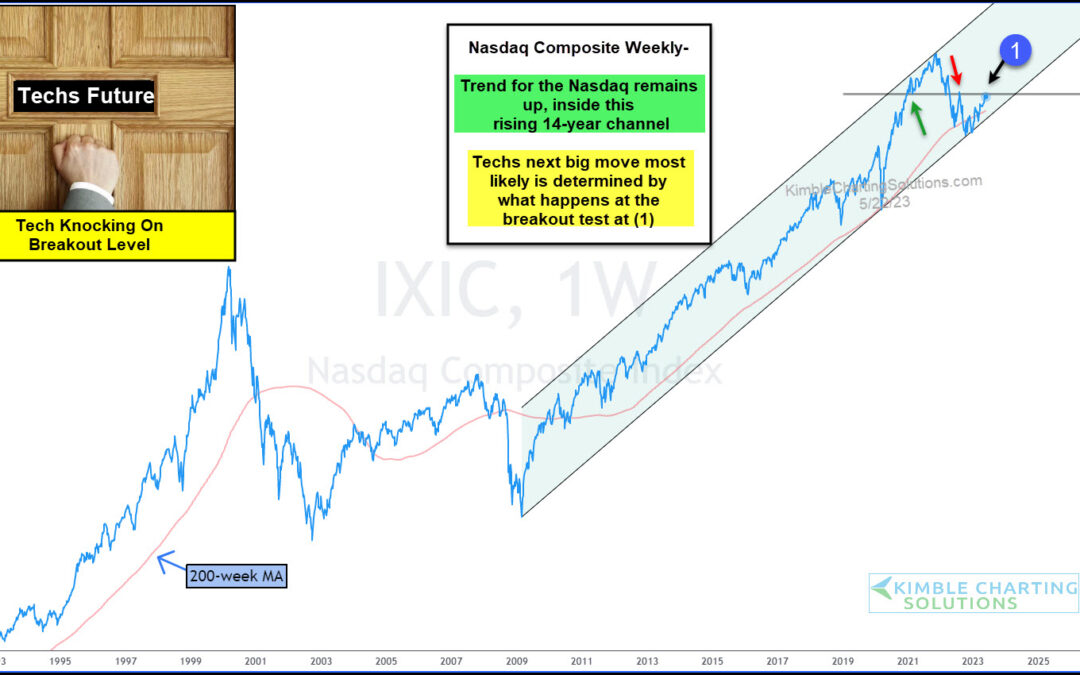
Technology stocks continue to lead the broader market higher. Without them, who knows where the stock market would be!! Today’s chart highlights Tech’s leadership, along with it’s long-term rising trend. Below you will see a “weekly” chart of the Nasdaq Composite. As...
by Chris Kimble | Apr 20, 2023 | Kimble Charting
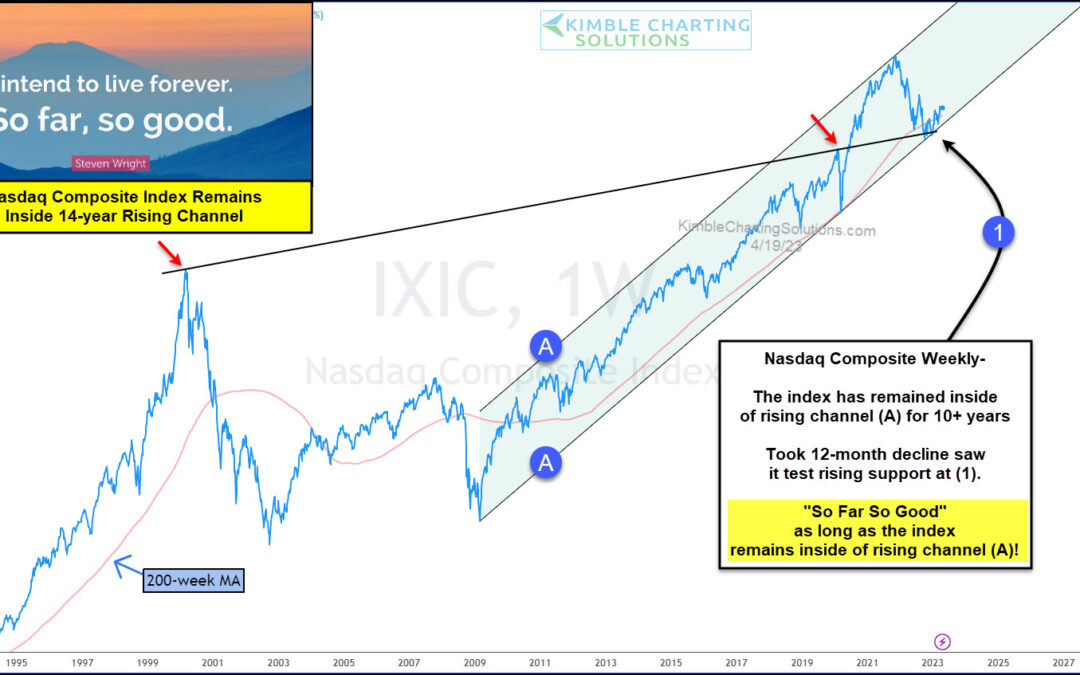
As we have pointed out several times, tech stocks have lead the the bull market since the financial crisis. And today’s chart highlights that as well as crucial 14-year bull market support. Below is a “weekly” chart of the Nasdaq Composite. As you can see, the Nasdaq...
by Chris Kimble | Apr 10, 2023 | Kimble Charting
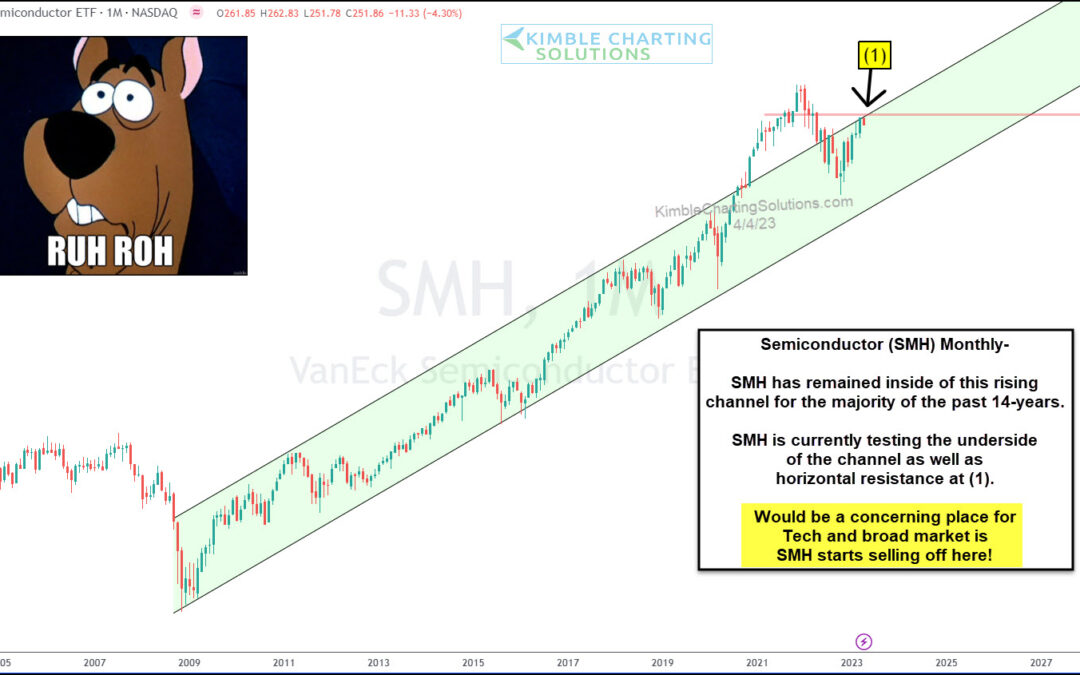
One of the bull market leaders of the past 14 years is trading into critical resistance. And what happens next could decide the next turn for tech stocks. That’s right, we are talking about Semiconductors… again. We have routinely highlighted key moments across...
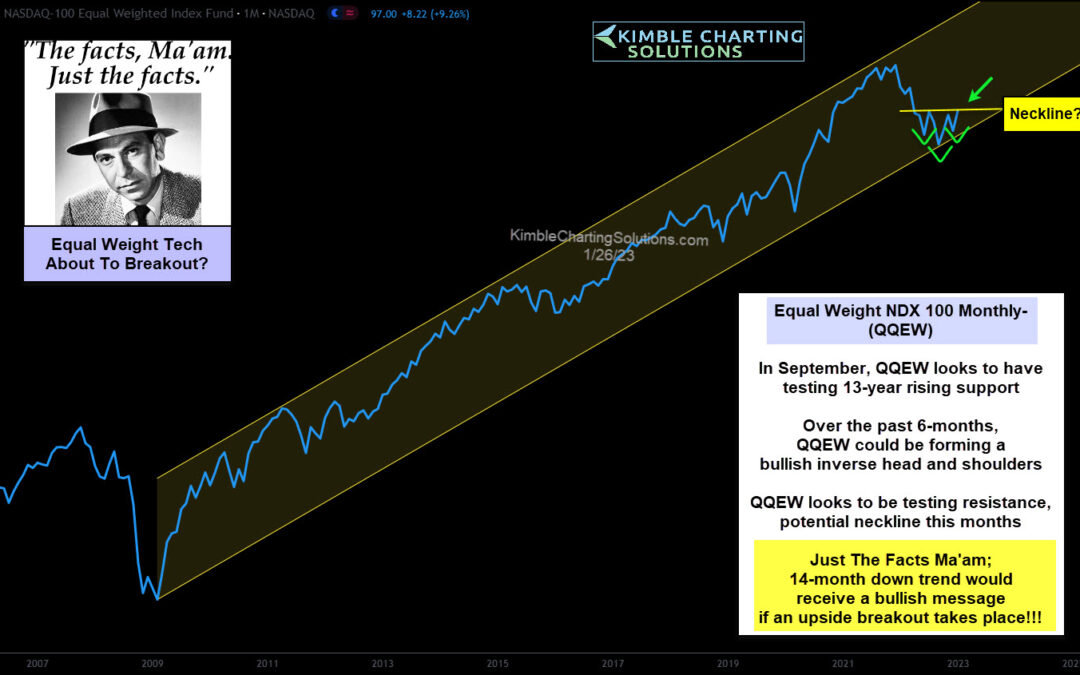
by Chris Kimble | Jan 27, 2023 | Kimble Charting
Investors are hoping that a strong January is just the start to a strong recovery for stock prices. Particularly, tech stock prices. The selloff hit tech stocks particularly hard as a slowing economy and inflation are strong headwinds for growth stocks. Investors hope...
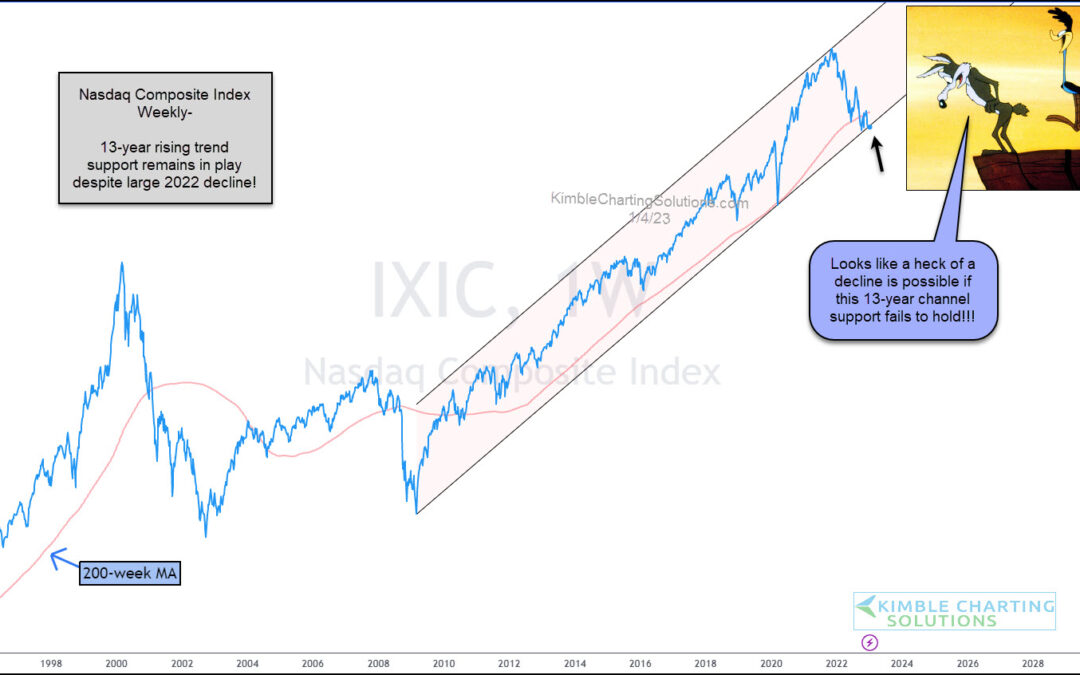
by Chris Kimble | Jan 5, 2023 | Kimble Charting
Despite a 33% decline in the Nasdaq, this key stock market index remains inside of this 13-year rising channel. Barely. Today’s long-term “weekly” chart of the Nasdaq Composite Index highlights just how tenuous the bull market is right now. And why investors need to...
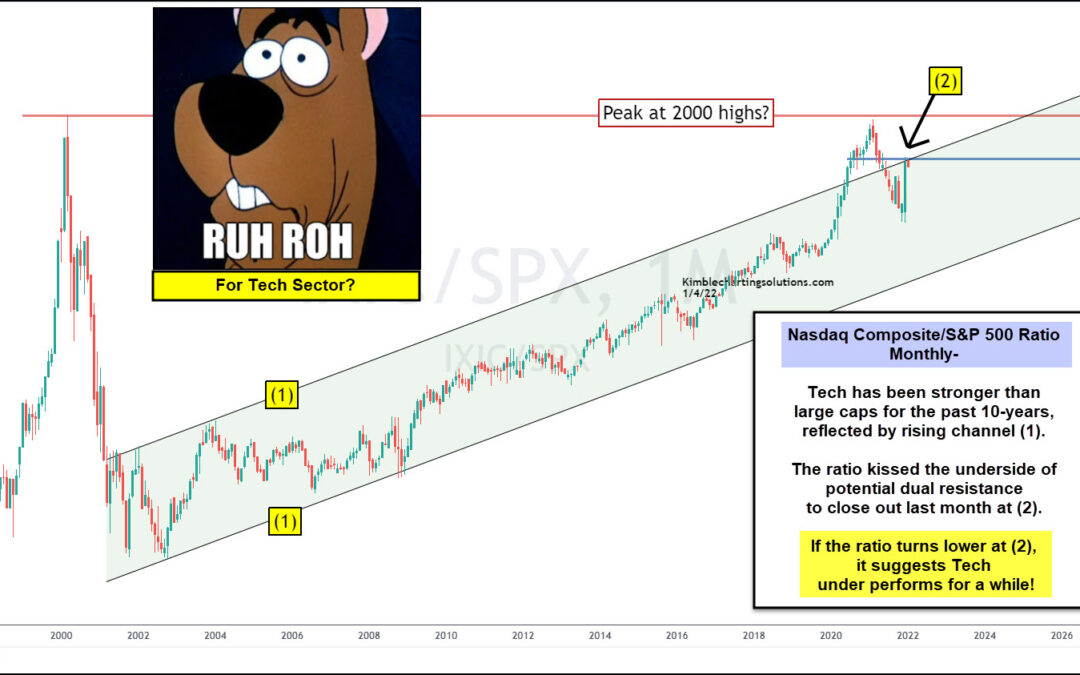
by Chris Kimble | Jan 5, 2022 | Kimble Charting
Tech stocks began under-performing the broader market several months ago when the ratio of the Nasdaq Composite to S&P 500 Index peaked out at the 2000 high. This is worth noting because this tech ratio has been in a rising up-trend for the past two decades,...
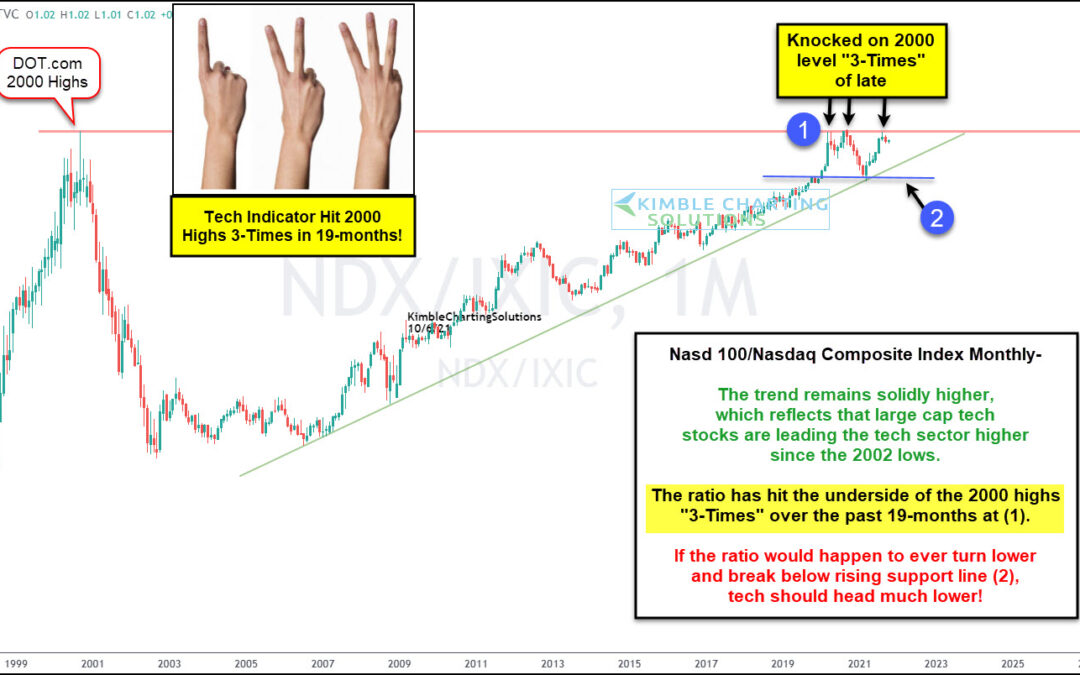
by Chris Kimble | Oct 7, 2021 | Kimble Charting
Tech stocks have played a major leadership role in the 12 year advance off the 2008-2009 stock market low. But within that leadership silo, it has been large-cap tech stocks that have been the real leaders. Today’s chart highlights this by showing the ratio of the...
