by Chris Kimble | May 23, 2024 | Kimble Charting
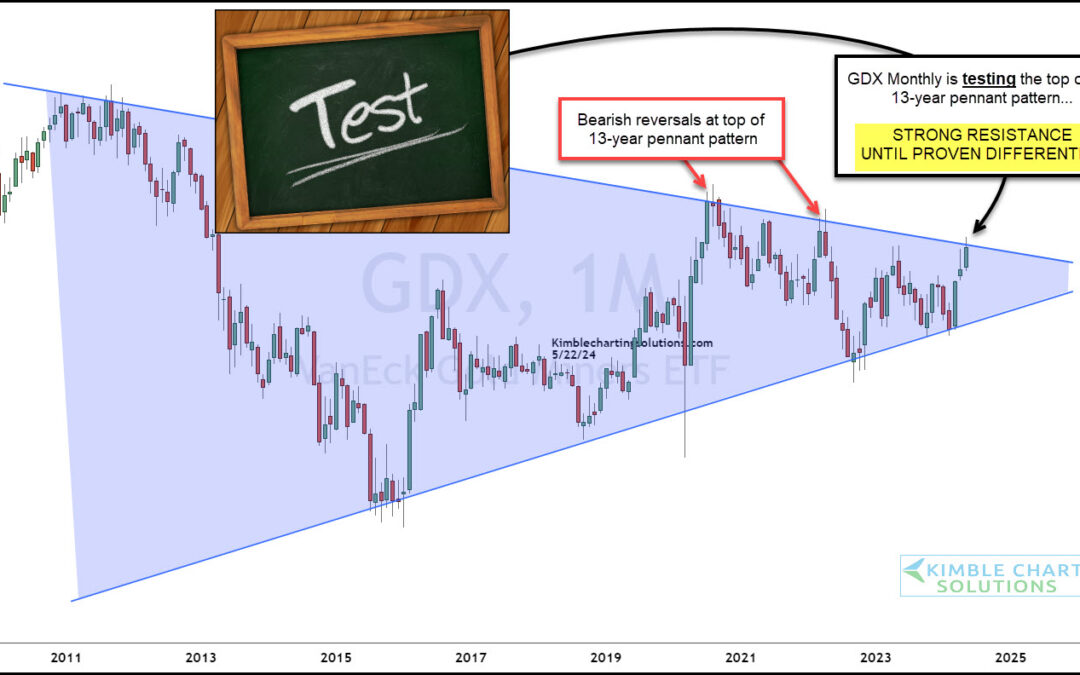
Gold prices have moved steadily higher and this has provided a strong tailwind to gold mining stocks. Today, we’ll highlight a very bullish setup in this sector by looking at the Gold Miners ETF (GDX). The chart below is a long-term “monthly” chart that highlights a...
by Chris Kimble | Aug 6, 2021 | Kimble Charting
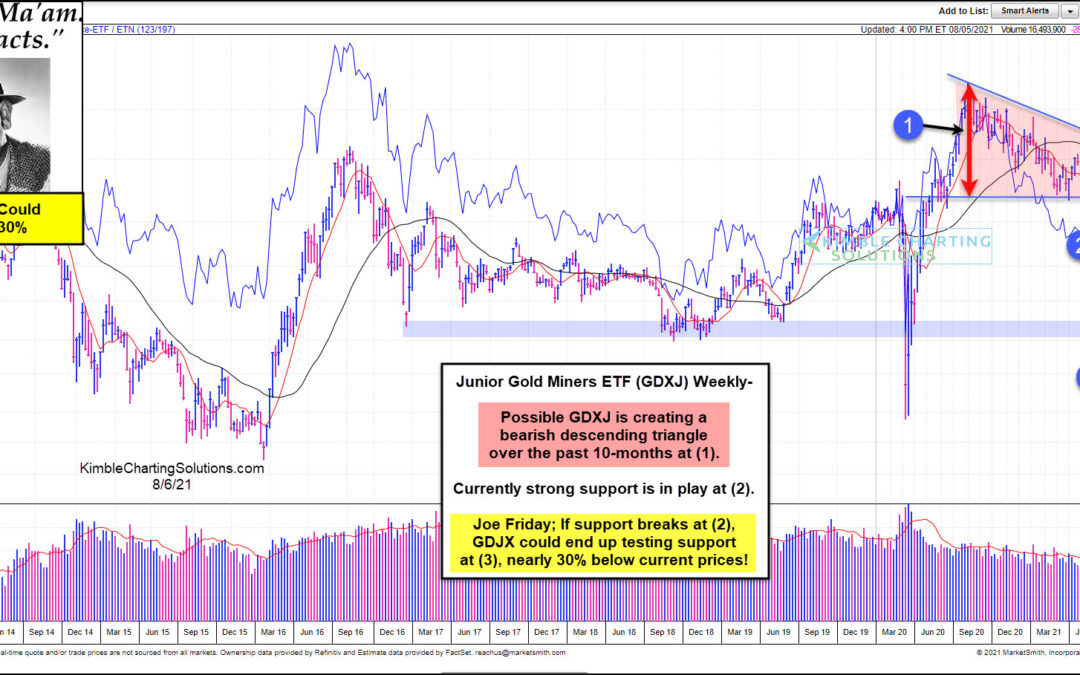
This chart comes from Marketsmith.com, which looks at Junior Gold Miners ETF (GDXJ). This chart highlights that GDXJ could be creating a bearish descending triangle over the past 10-months at (1). Currently, GDXJ is testing an important support line at (2). Joe Friday...
by Chris Kimble | Jul 21, 2021 | Kimble Charting
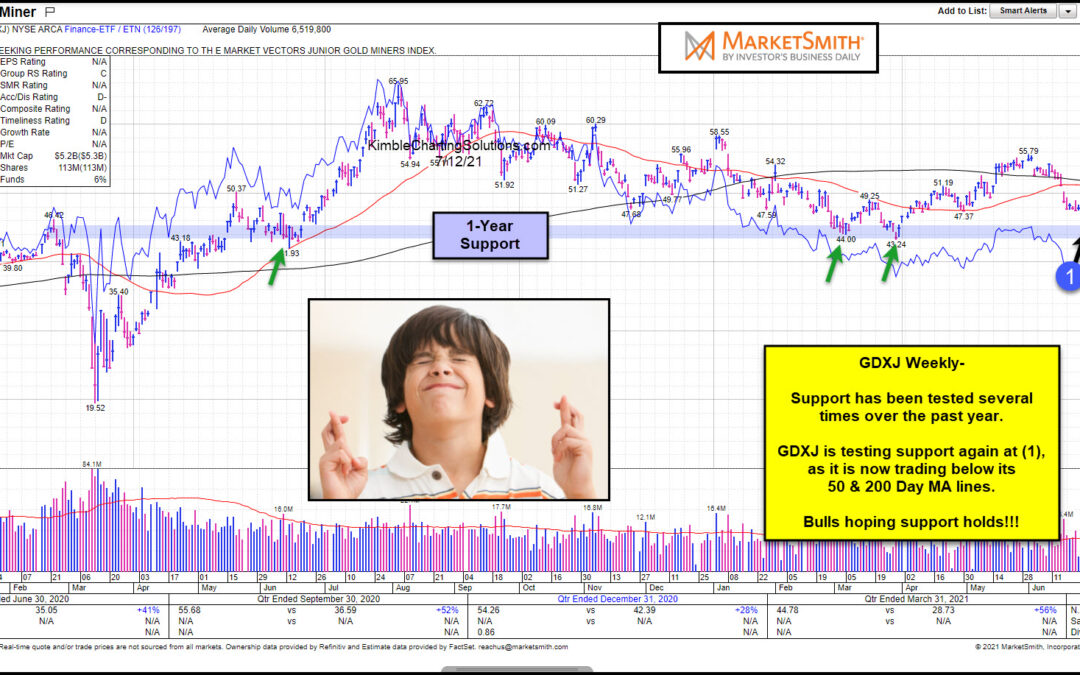
Trading momentum indicators slowed down several months ago for the precious metal industry. And, as any investor might imagine, gold and silver stocks have struggled. Especially mining stocks. Today we take a look at the Junior Gold Miners ETF (GDXJ), highlighting...
by Chris Kimble | Mar 30, 2021 | Kimble Charting
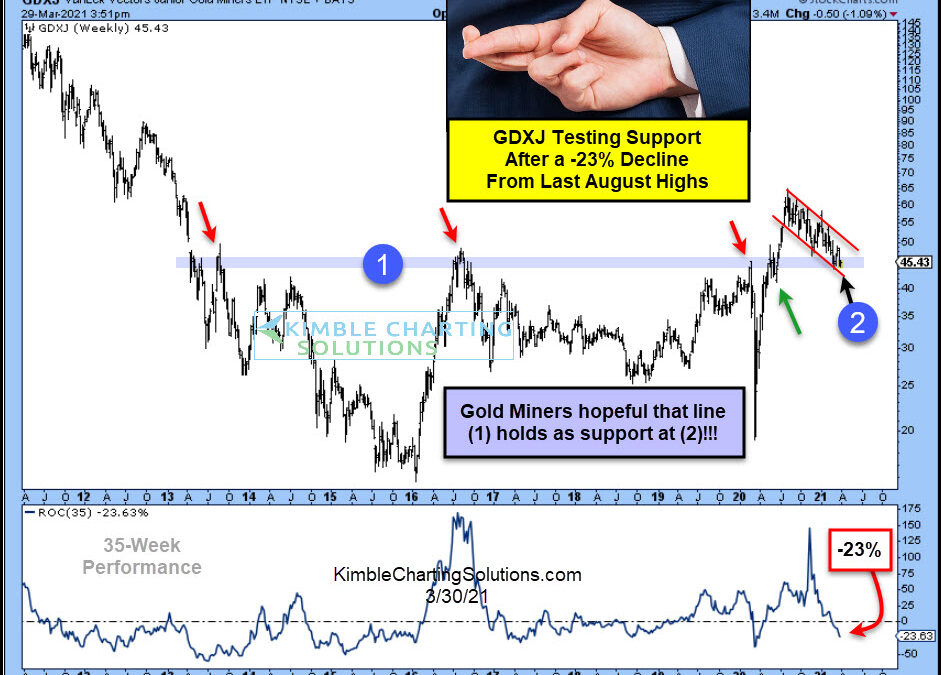
Gold mining stocks have struggled since last August, as they have lost nearly 25% in price, putting them into the bear market territory. Is this enough of a decline? Gold miners have their fingers crossed this critical support holds right now! The chart looks at...
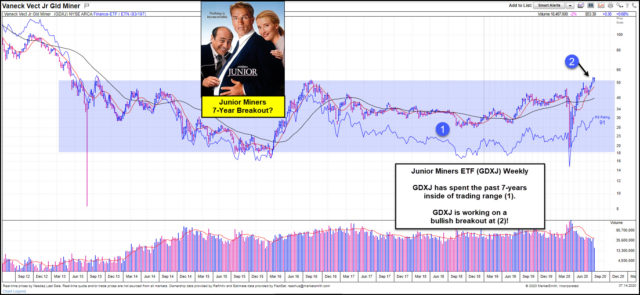
by Chris Kimble | Jul 15, 2020 | Kimble Charting
Its been a long 7-years if you happened to buy Junior miners ETF (GDXJ) back in 2013, as it has traded sideways since those highs. This chart comes from Marketsmith.com, which reflects that GDXJ is trading above long-term moving averages and its relative strength...
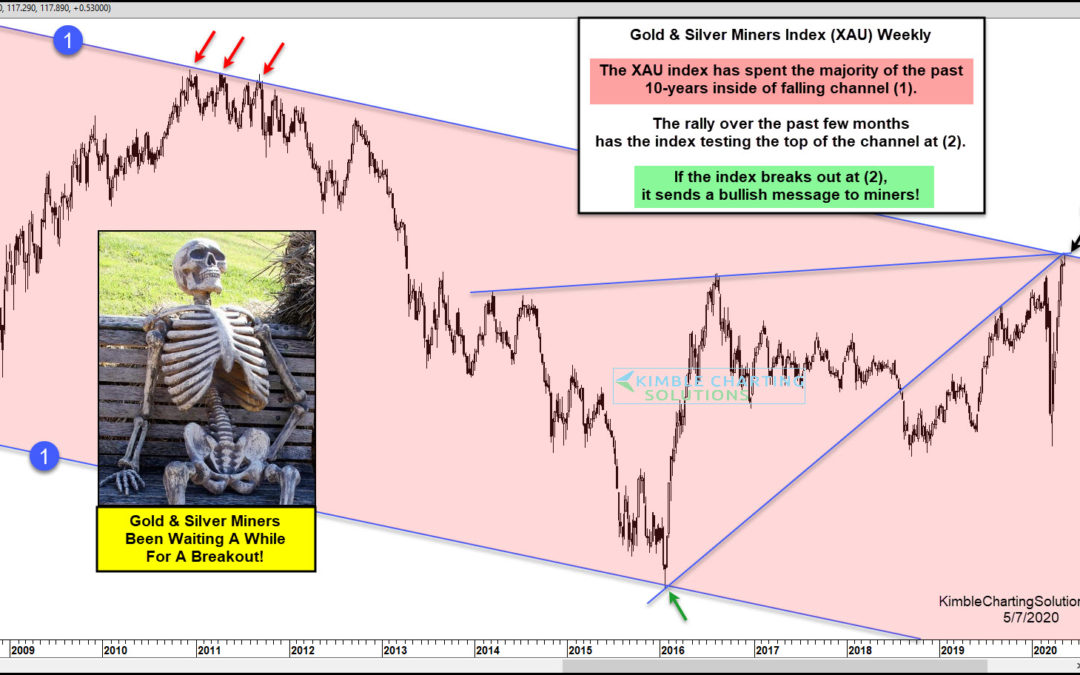
by Chris Kimble | May 7, 2020 | Kimble Charting
Are Gold & Silver Miners about to send a bullish message for the first time in 10-Years? We will see soon! The Gold & Silver Miners Index (XAU) has created a series of lower highs and lower lows inside of falling channel (1) over the past decade-plus. The...
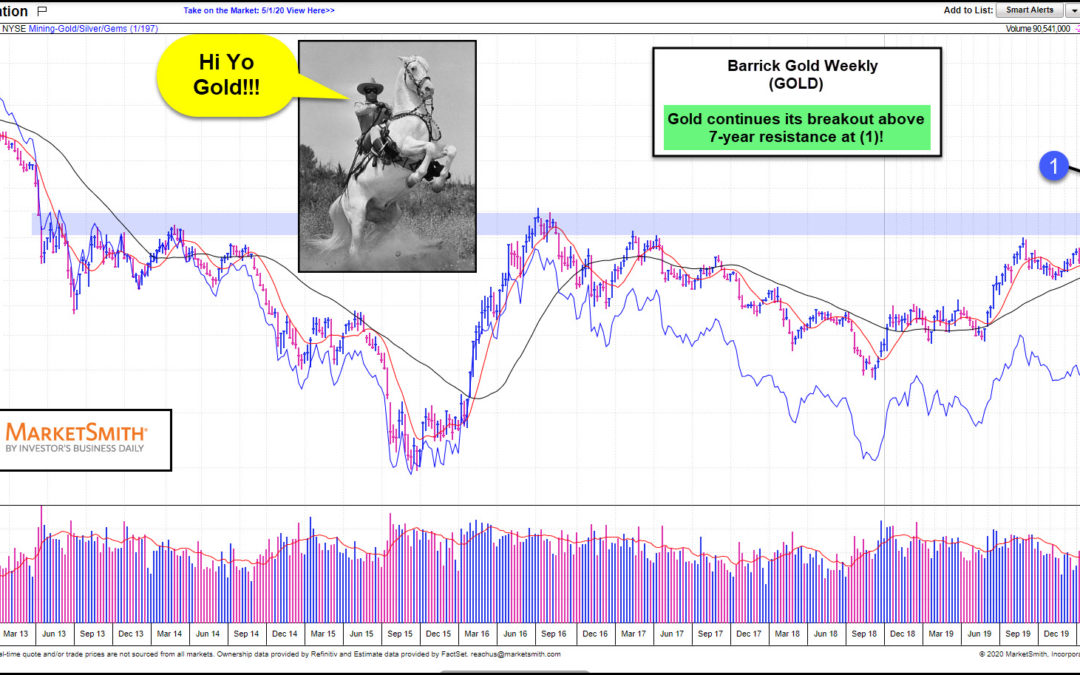
by Chris Kimble | May 2, 2020 | Kimble Charting
Is it “Hi-Yo Gold” time? At least in the short-term, it is! This chart looks at Barrick Gold Corp (GOLD) on a weekly basis. Gold has struggled to break above the blue shaded resistance zone for years, which comes into play just below the $23 level. This...
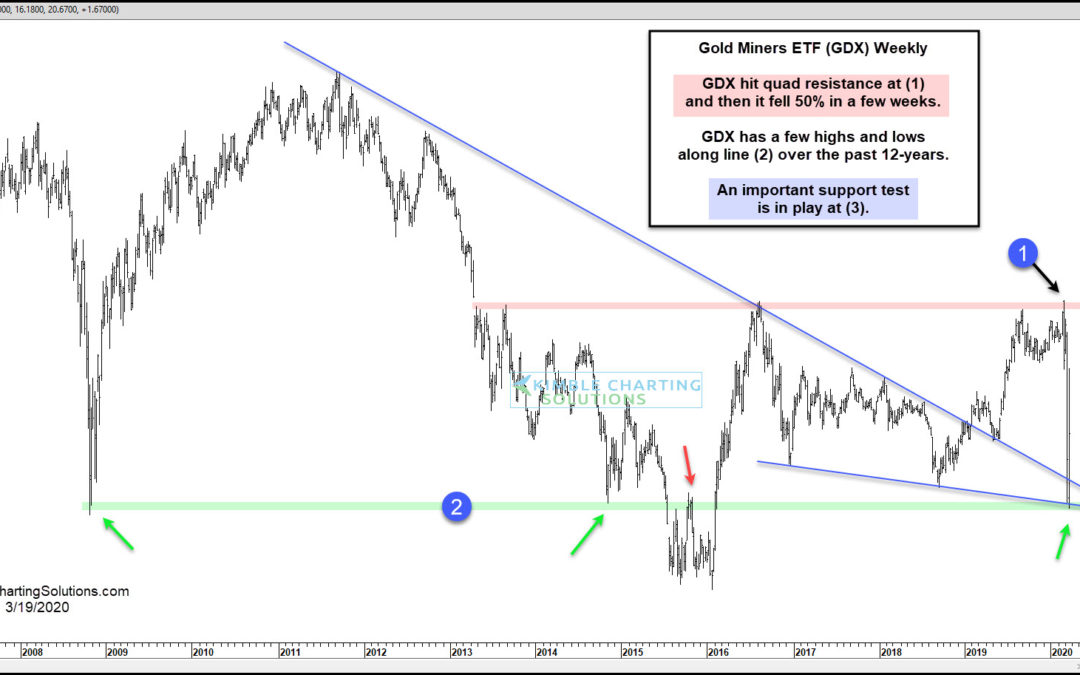
by Chris Kimble | Mar 19, 2020 | Kimble Charting
Gold miners ETF (GDX) failed to break above resistance on its 4th try a few weeks ago at (1), and then it was met by a large degree of selling pressure. After hitting this resistance, sellers stepped in and drove it down nearly 50% in just a few weeks. The decline...
