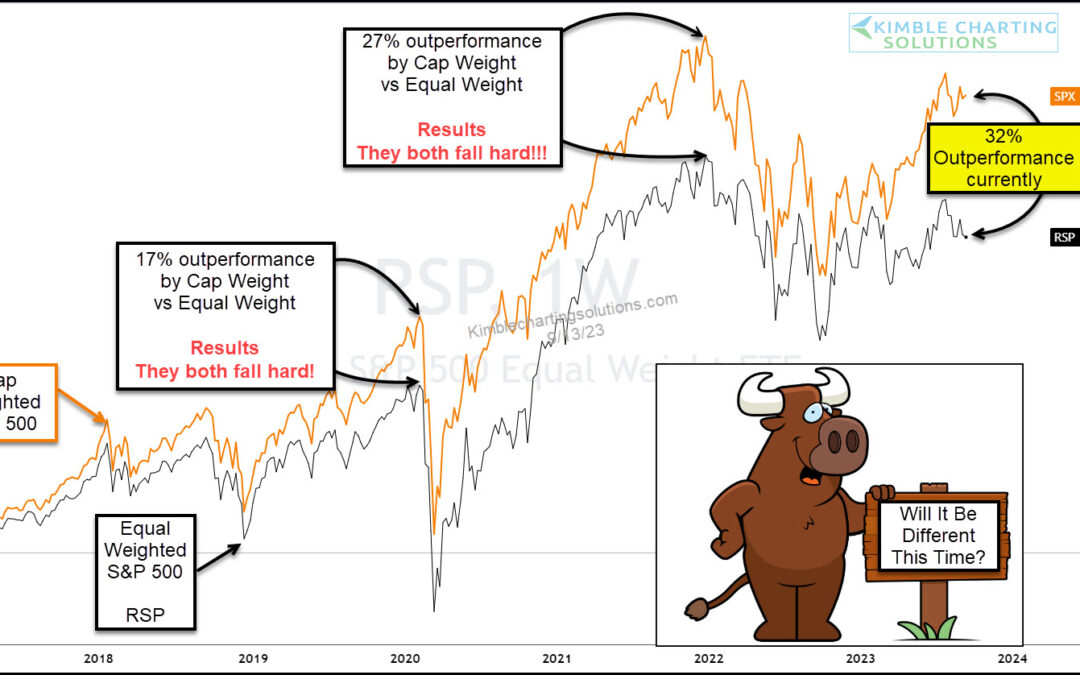
by Chris Kimble | Sep 14, 2023 | Kimble Charting
We often watch the performance of cap weighted indices versus the equal weight counterpart. Why? Because divergences in performance often signal market turns. Today is no different as we display the performances of the S&P 500 cap weight index versus the S&P...
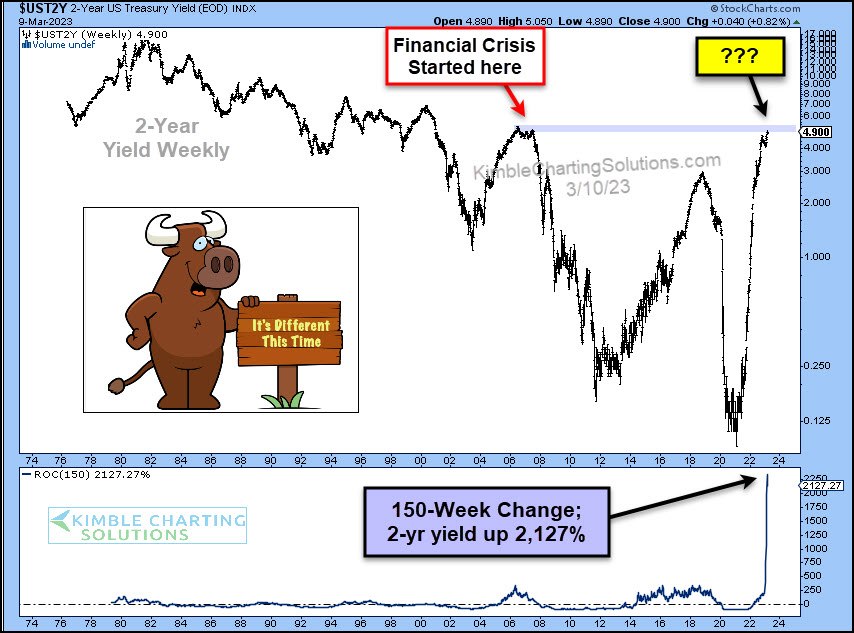
by Chris Kimble | Mar 10, 2023 | Kimble Charting
With bond yields (and interest rates) rising sharply, it’s understandable that most of the world is hoping for lower rates. Lower interest rates allow for more flexible lending to both businesses and consumers… BUT… As the “weekly” chart below shows, the last time...
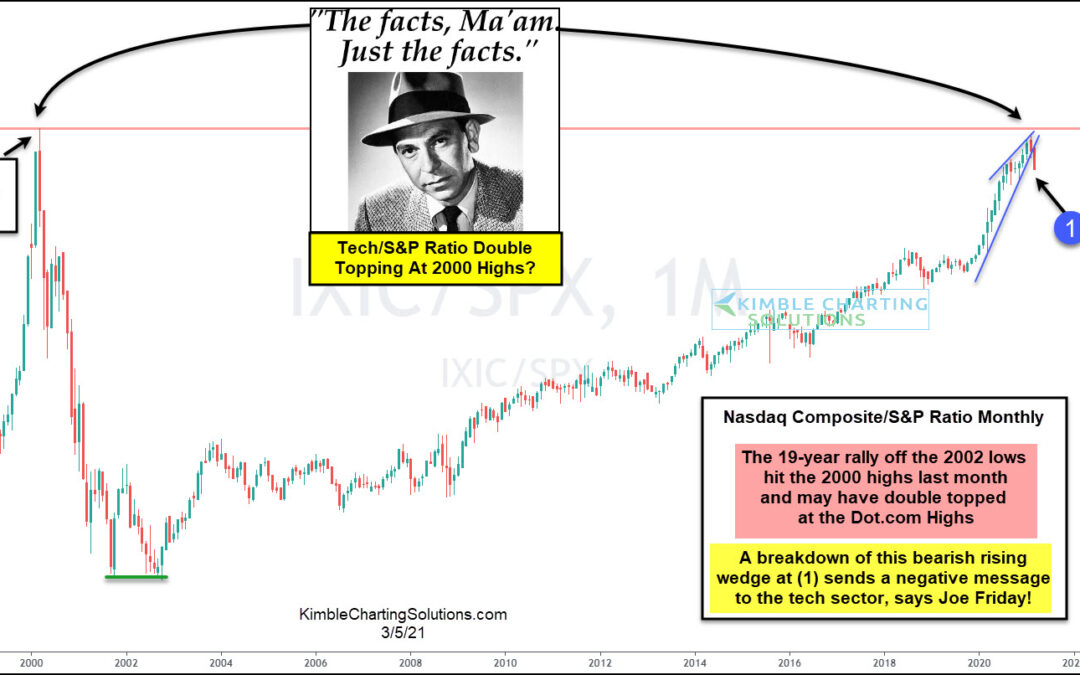
by Chris Kimble | Mar 5, 2021 | Kimble Charting
Technology is at the heart of our economy… the same way that industrials were 100 years ago. And that leadership has been present in the stock market for the past two decades. Today’s chart illustrates this… as well as a potential “pause” in that leadership vacuum....
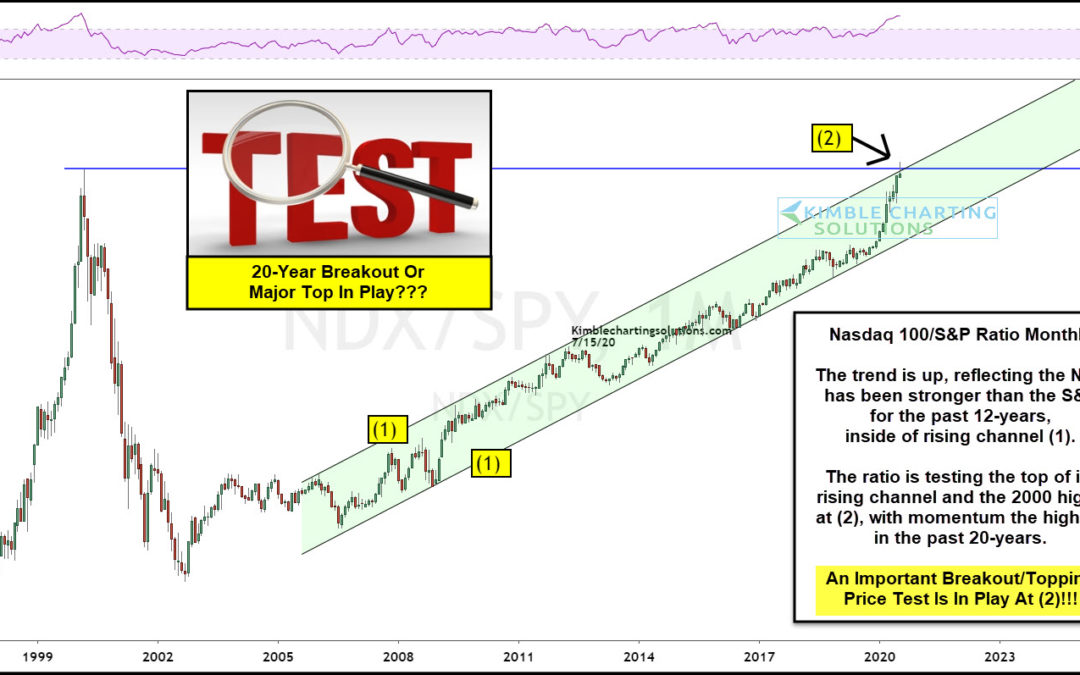
by Chris Kimble | Jul 16, 2020 | Kimble Charting
Is the latest ramp higher and Large-cap tech stocks have been the clear market leader, out-performing the broad market for months. In today’s chart, we look at the Nasdaq 100 to S&P 500 performance ratio in an effort to answer the question: Is the ramp higher in...
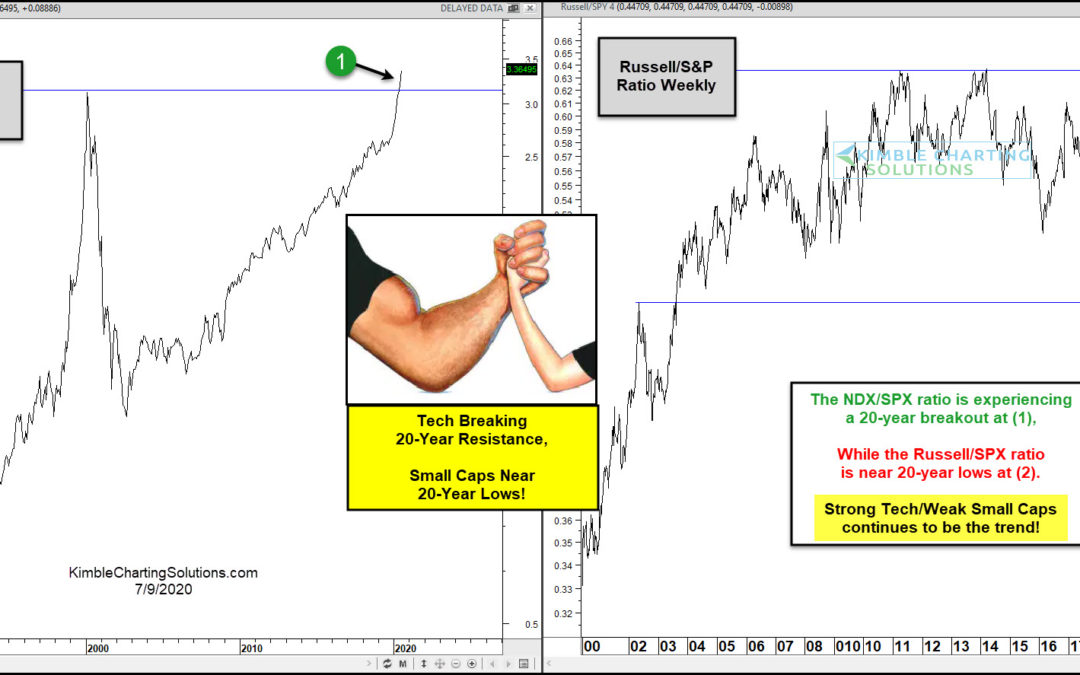
by Chris Kimble | Jul 9, 2020 | Kimble Charting
Successful investors are often rewarded by owning strength and avoiding weakness. Could two key sectors be experiencing 20-year strength and weakness extremes at the same time? Yes! The NDX 100/S&P ratio (left above) is currently experiencing a 20-year breakout at...
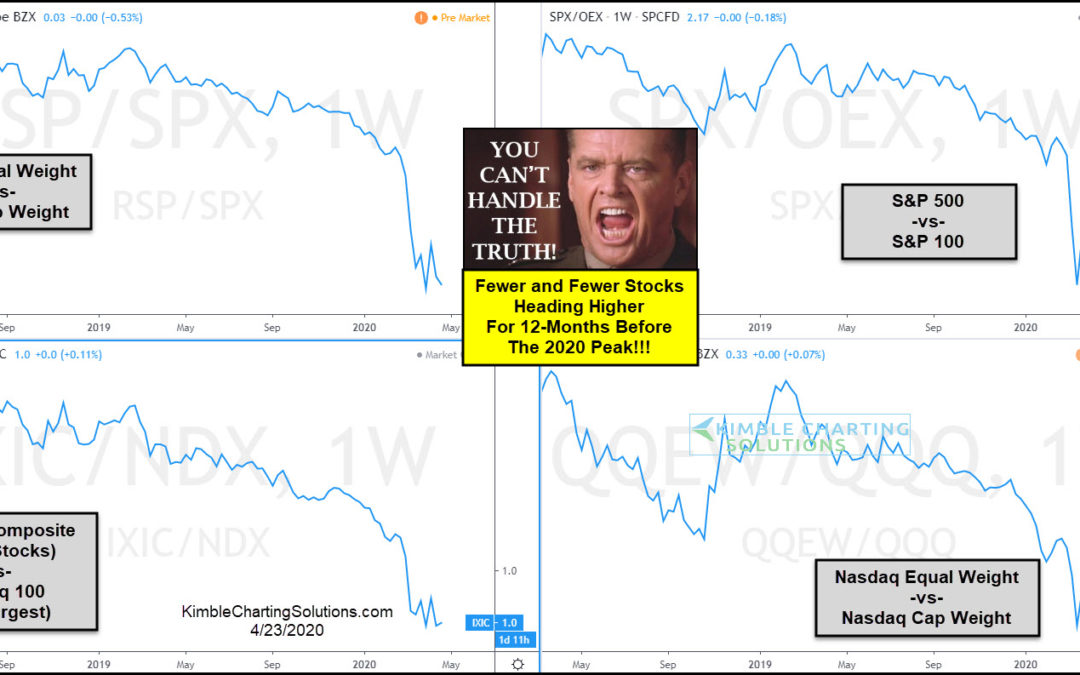
by Chris Kimble | Apr 23, 2020 | Kimble Charting
Was the decline in the first quarter of 2020 a “Black Swan” event? In my 40-years in the business, I don’t think I’ve ever heard the phrase, “this was a Black Swan event” so frequently used. Was the virus and resulting quarantine a...
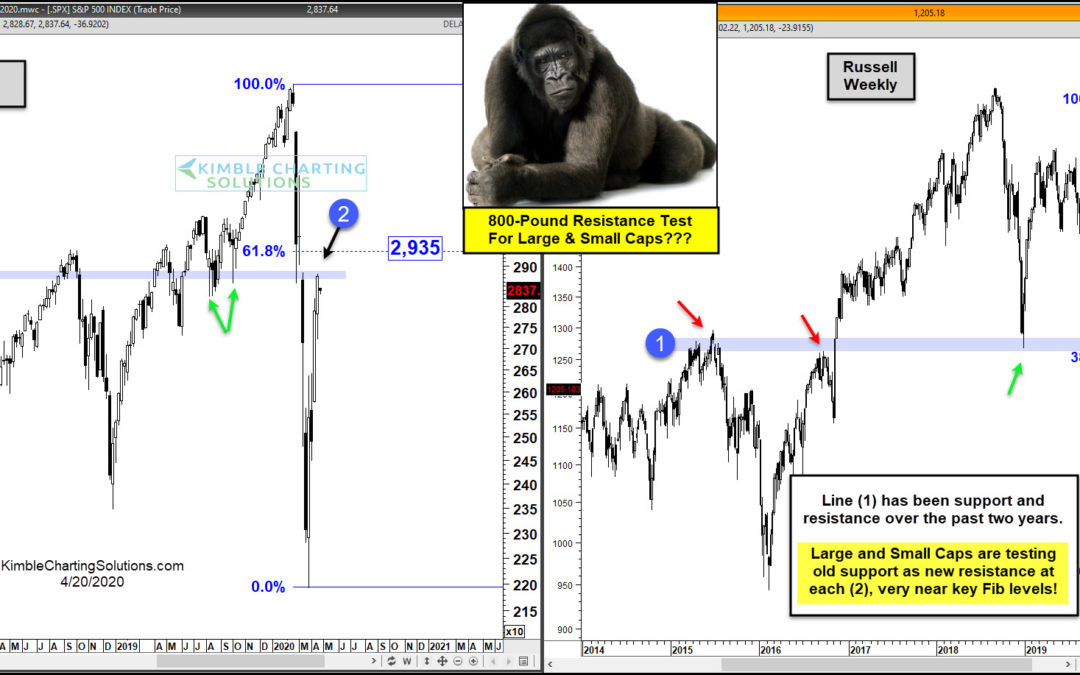
by Chris Kimble | Apr 21, 2020 | Kimble Charting
The stock market rally from the March crash lows has been sharp but lumpy. The S&P 500 Index and large cap stocks have lead the way higher, while the Russell 2000 Index and small cap stocks have lagged. That said, today’s chart highlights a significant overhead...
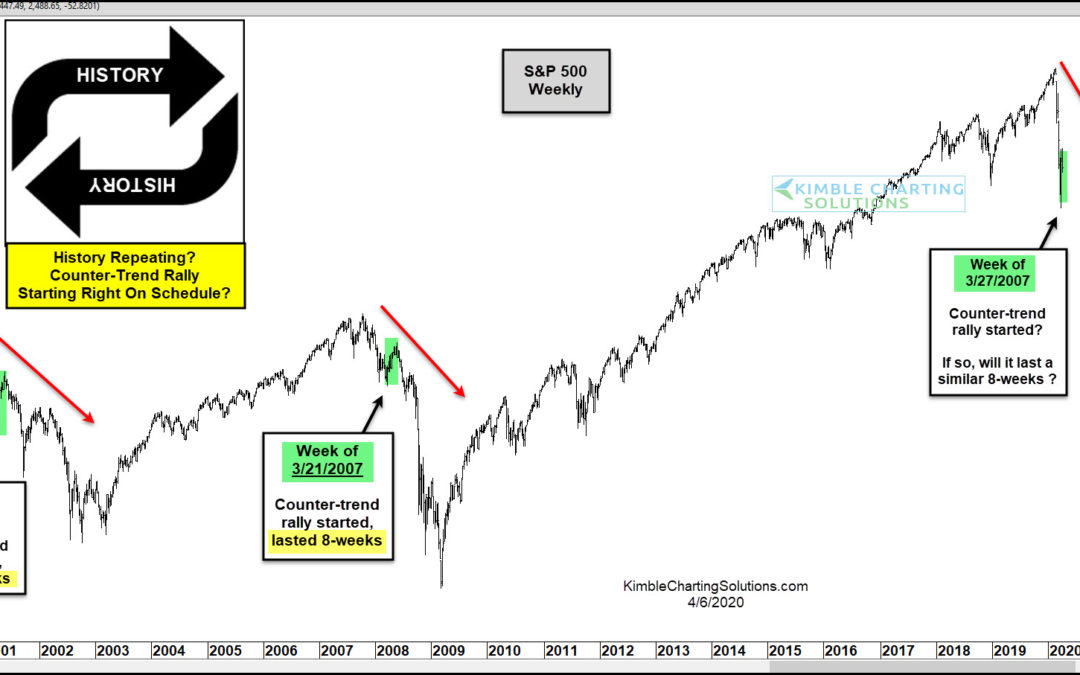
by Chris Kimble | Apr 6, 2020 | Kimble Charting
Does History Repeat? Is does rhyme sometimes!!! This chart looks at the S&P 500 on a weekly basis over the past 20-years. The S&P declined by 50% during the 2000-2003 bear market. On the week of 3/23/2001, it experienced its first counter-trend rally, which...
