by Chris Kimble | May 23, 2024 | Kimble Charting
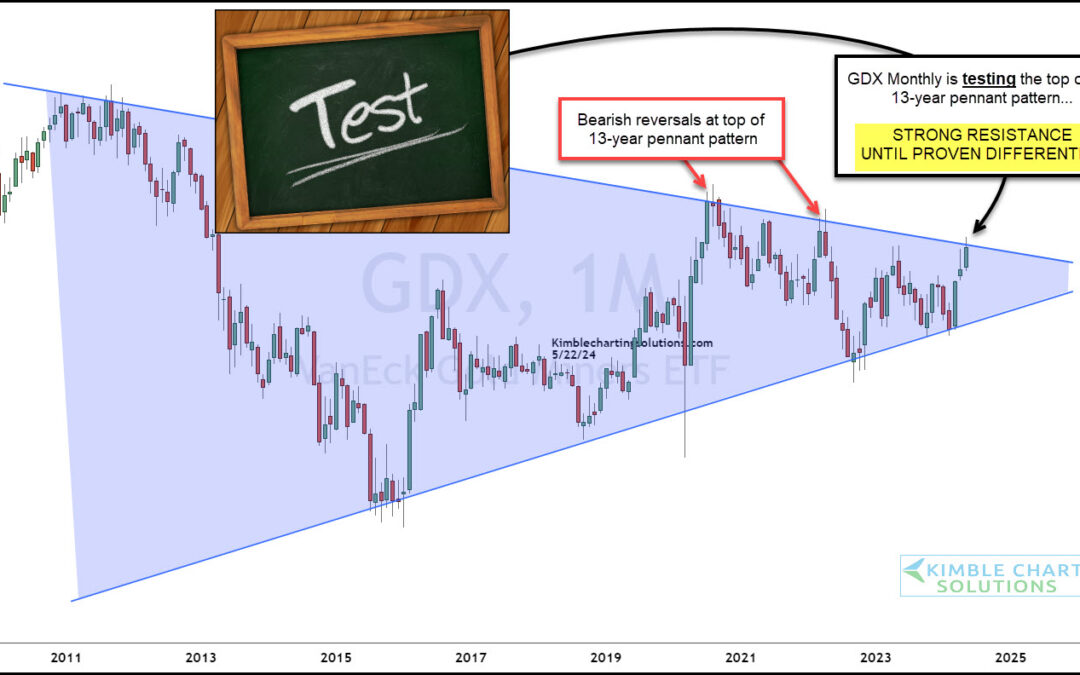
Gold prices have moved steadily higher and this has provided a strong tailwind to gold mining stocks. Today, we’ll highlight a very bullish setup in this sector by looking at the Gold Miners ETF (GDX). The chart below is a long-term “monthly” chart that highlights a...
by Chris Kimble | Jul 13, 2023 | Kimble Charting
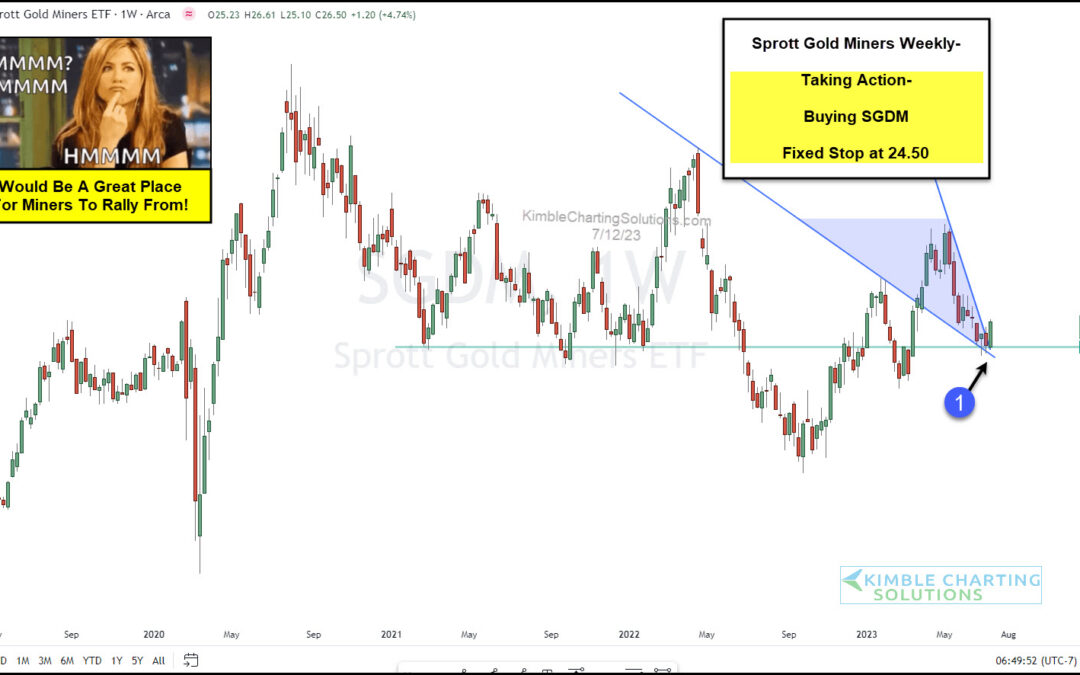
The precious metals complex may be ending a 2 month pullback / consolidation pattern. And perhaps in grand fashion! With Gold and Silver prices bouncing off key price support, we are seeing similar action in the Gold Mining stocks. Today, we look at a “weekly” chart...
by Chris Kimble | Jun 9, 2023 | Kimble Charting
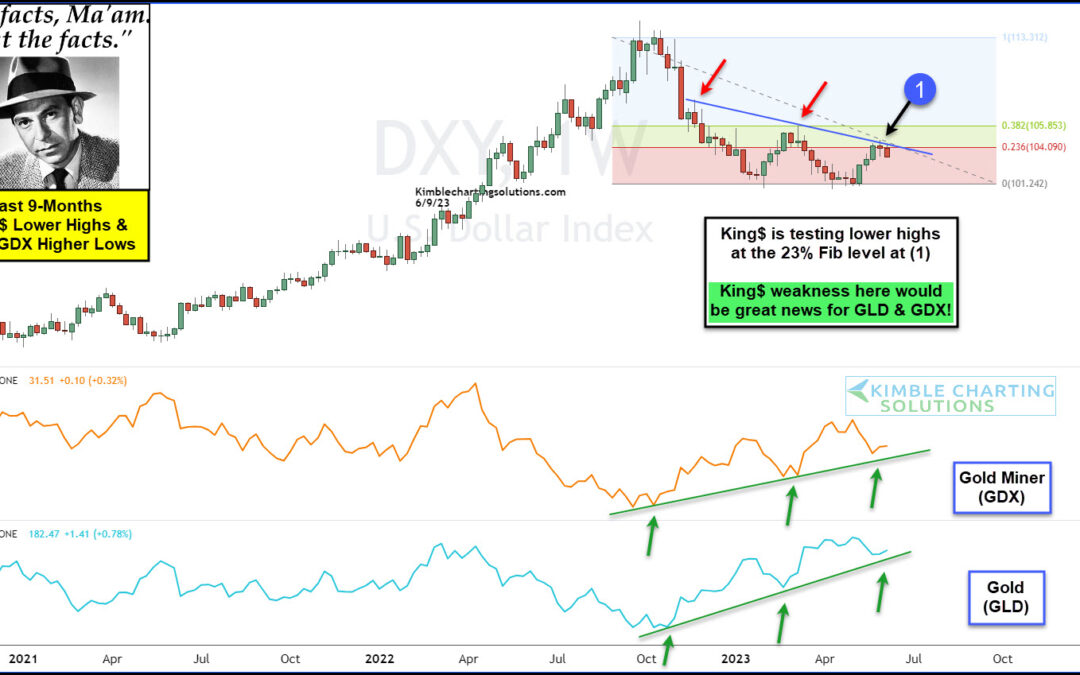
When the U.S. Dollar is strong, it is a headwind for precious metals. And when the U.S. Dollar is weak, it is a tailwind for precious metals. Today we check in on this relationship by looking at a “weekly” chart of the U.S. Dollar versus the Gold Miners ETF (GDX) and...
by Chris Kimble | Mar 13, 2023 | Kimble Charting
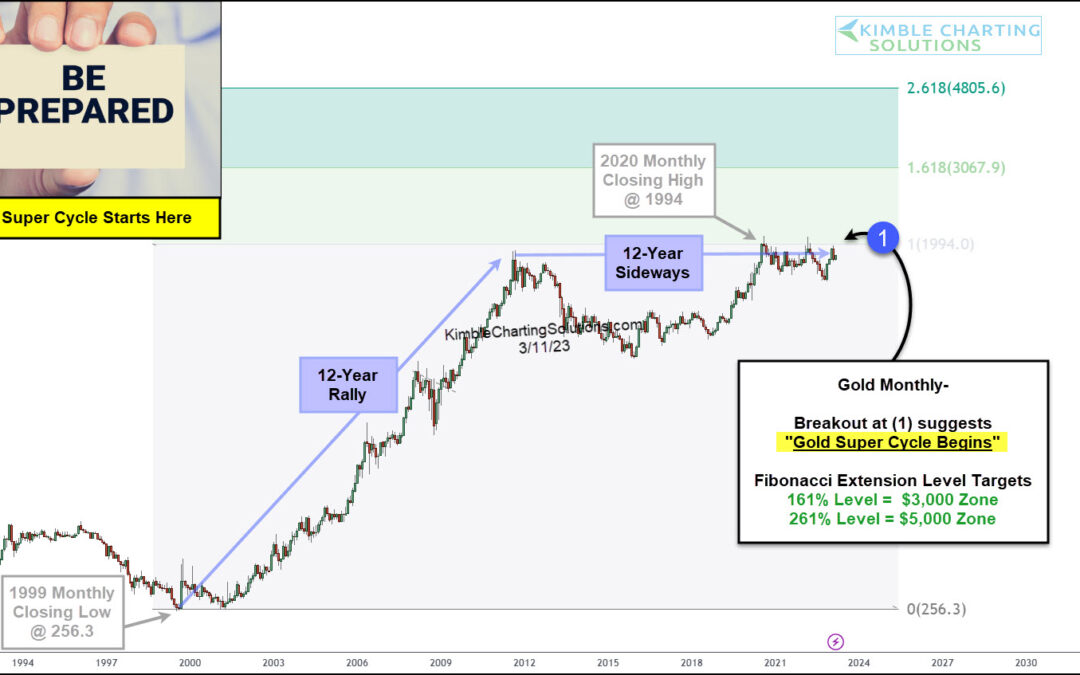
Nearly 12 years ago on 9/1/2011, I pointed to “the power of the pattern” and suggested that Gold should be flat to down for years to come. And, if you look at the chart below, you can see that this unfolded as expected. Fast forward to today (12-years later), and...
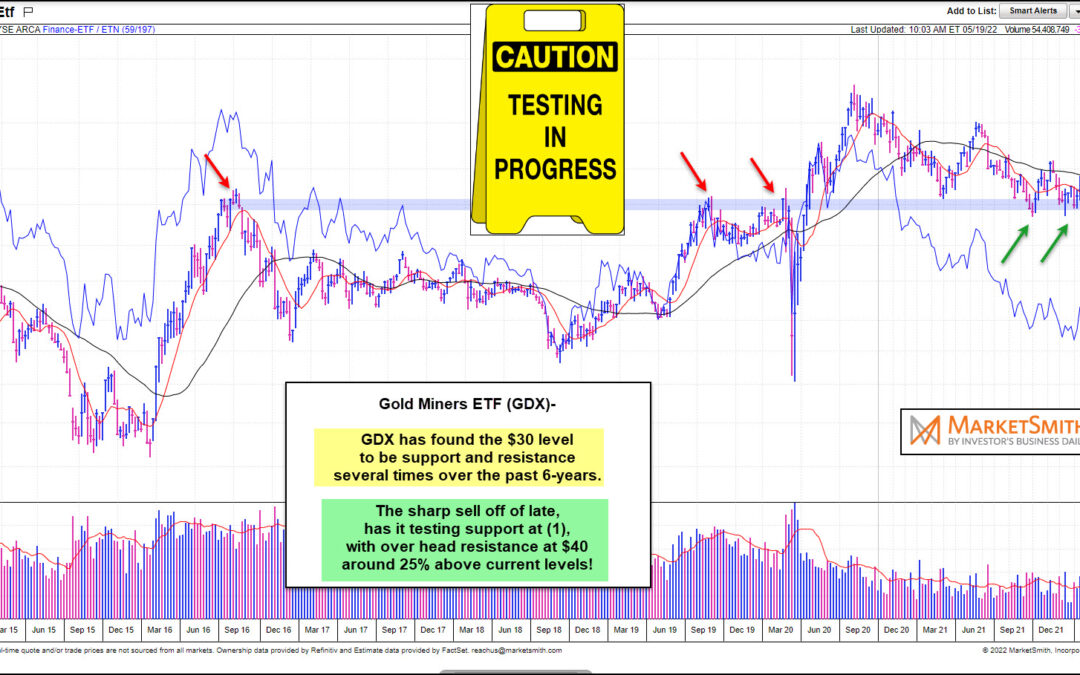
by Chris Kimble | May 20, 2022 | Kimble Charting
It’s been a rough past few weeks for the Gold Miners ETF (GDX). A bearish reversal in April has sent shares spiraling into May, down nearly 25%. Today’s “weekly” chart of the Gold Miners (GDX) from Marketsmith.com highlights this reversal, as well as important...
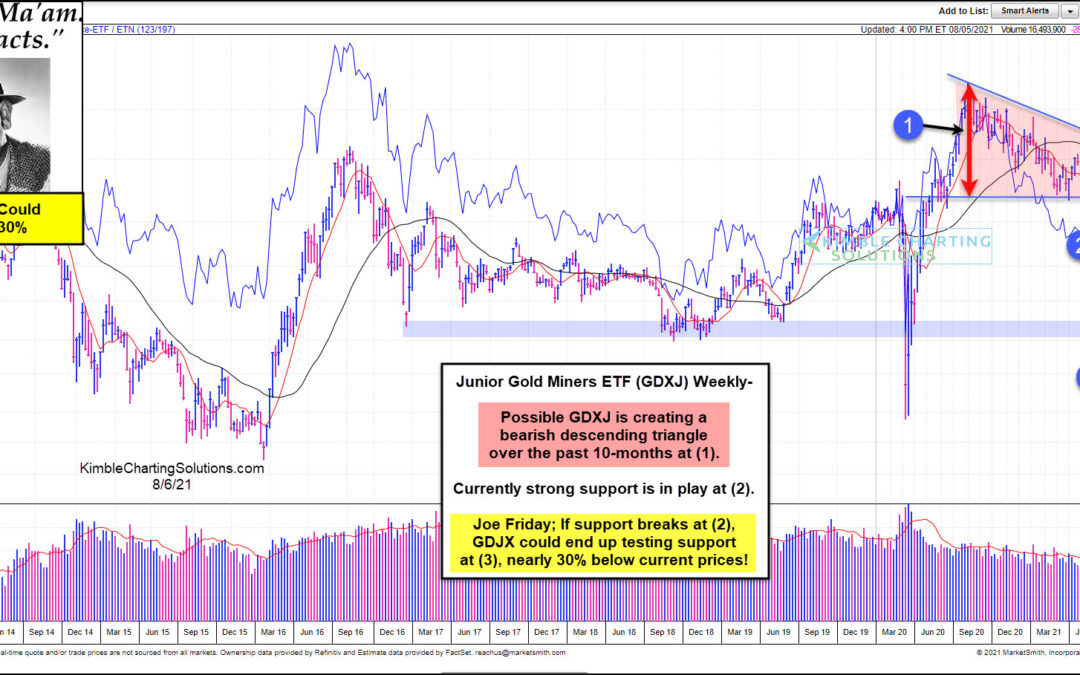
by Chris Kimble | Aug 6, 2021 | Kimble Charting
This chart comes from Marketsmith.com, which looks at Junior Gold Miners ETF (GDXJ). This chart highlights that GDXJ could be creating a bearish descending triangle over the past 10-months at (1). Currently, GDXJ is testing an important support line at (2). Joe Friday...
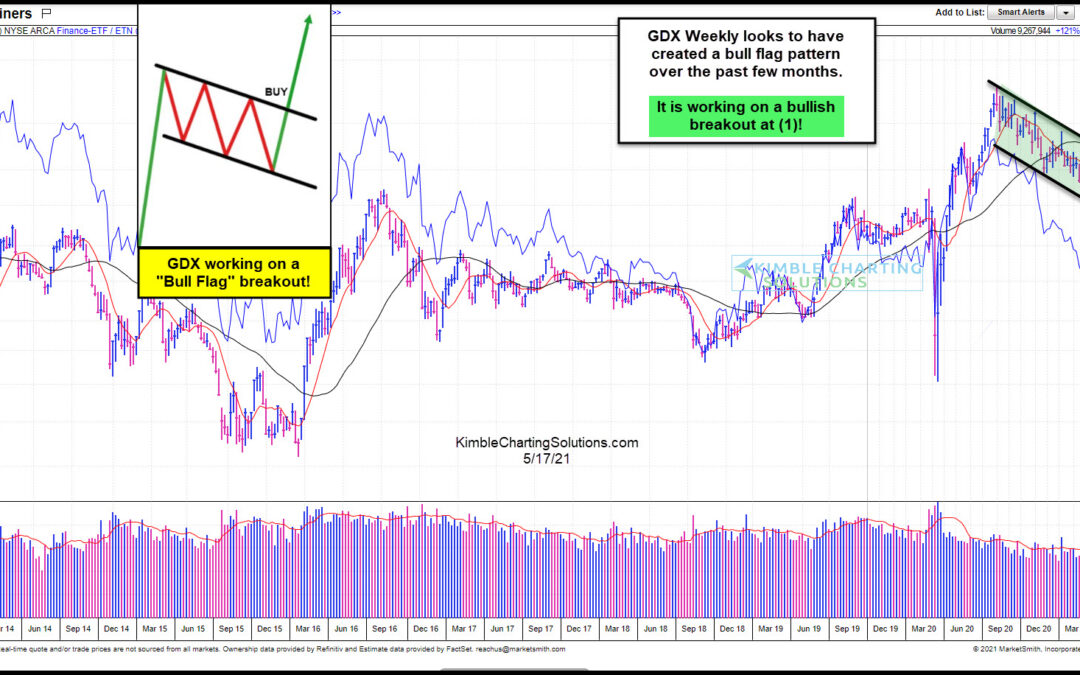
by Chris Kimble | May 18, 2021 | Kimble Charting
Gold has been working its way higher over the past 5 weeks and the gold mining stocks are reaping the benefits. Today’s chart from Marketsmith.com offers an intermediate-term look at the Gold Miners ETF (GDX) and its recent bull flag chart pattern and buy signal. As...
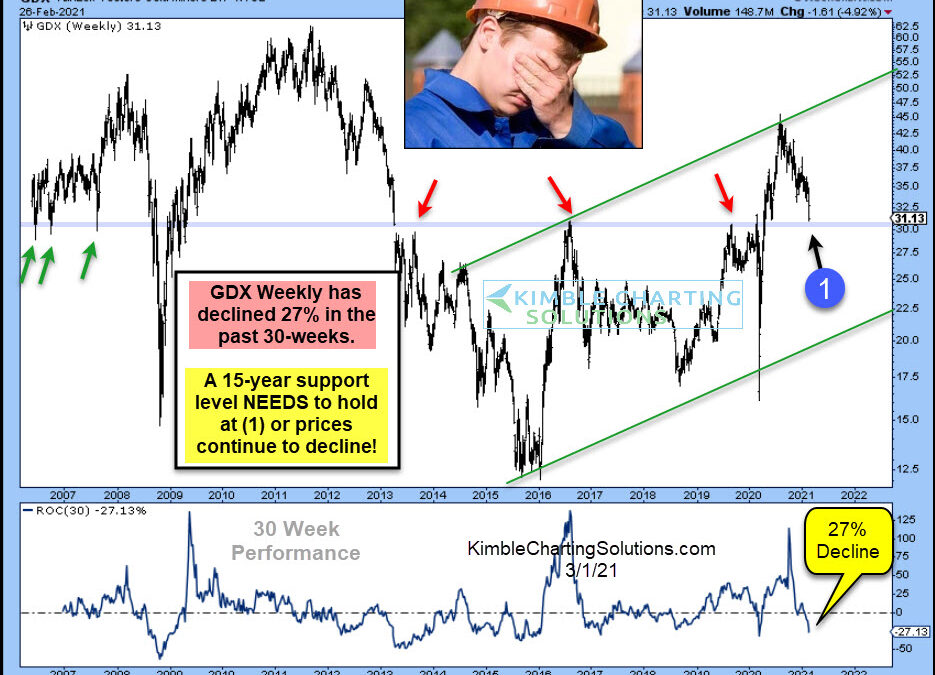
by Chris Kimble | Mar 1, 2021 | Kimble Charting
The past 8-months have been great for the broad markets, the same cannot be said for Gold Miners. Gold Miners ETF (GDX) has lost nearly a third of its value since peaking last August. This decline has taken place inside a bullish rising channel, that started at the...
