by Chris Kimble | Jul 7, 2023 | Kimble Charting
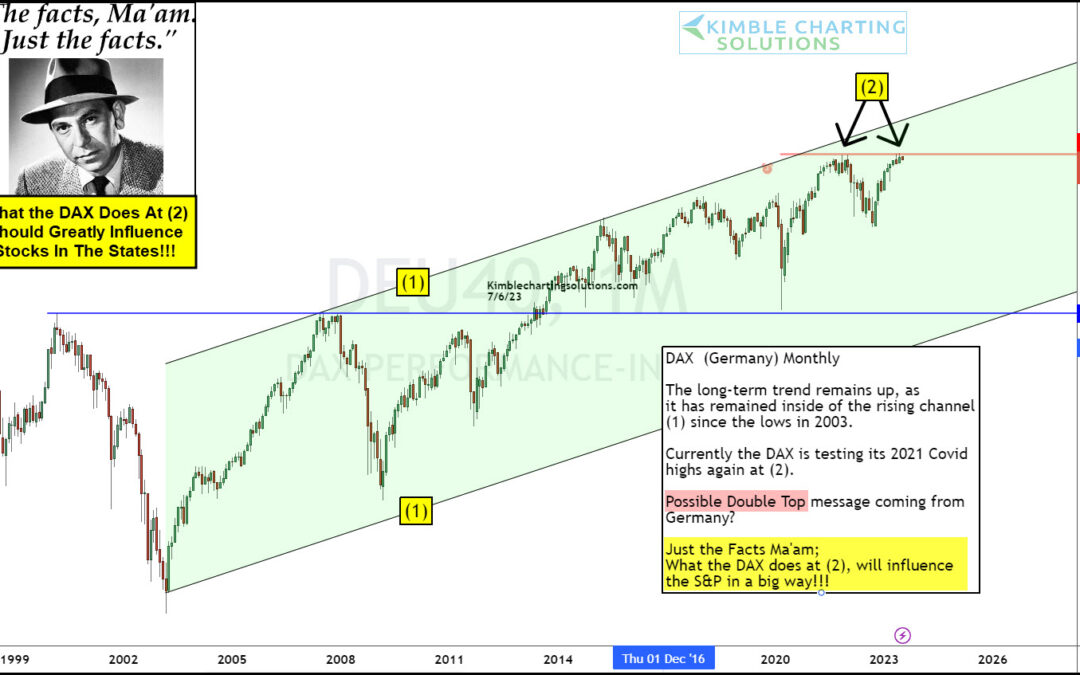
A recent review of global stock market indices put a major European index on my radar: The German DAX. The current price pattern for the DAX shows the index nearing a critical price point… and one that could send a broad message to U.S. stock market indices. “The...
by Chris Kimble | Mar 2, 2023 | Kimble Charting
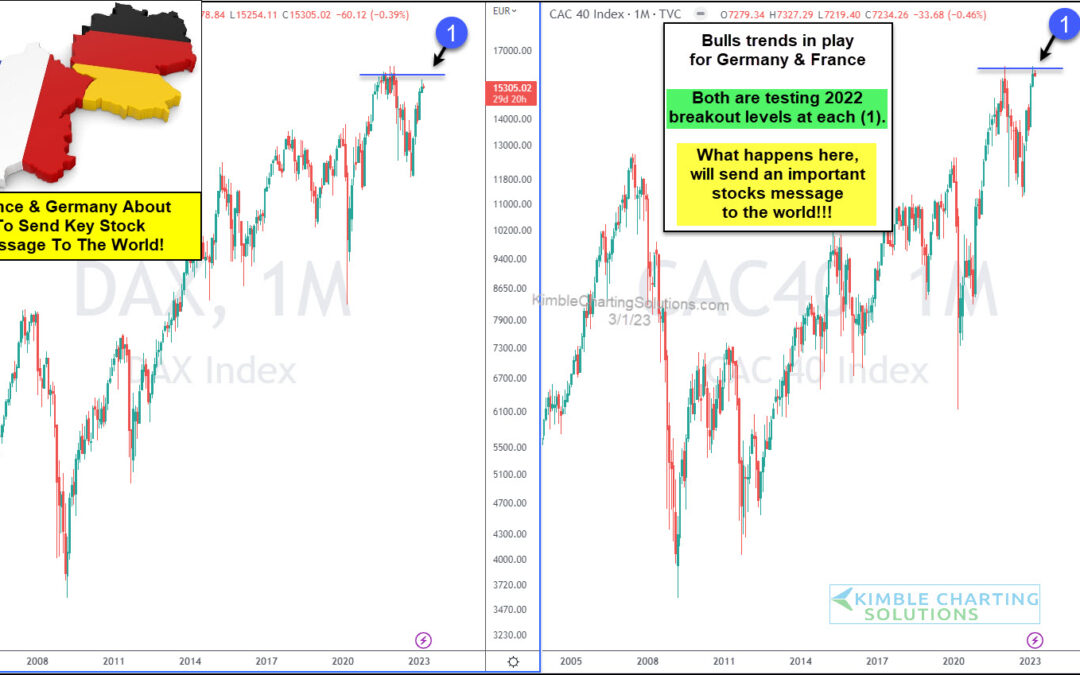
As we look across the major global stock market indices, we are seeing some divergences appear. And today we highlight one that appears to carry some importance. While the U.S. stock market indices are far from the 2022 highs, the same cannot be said for the German...
by Chris Kimble | May 14, 2020 | Kimble Charting
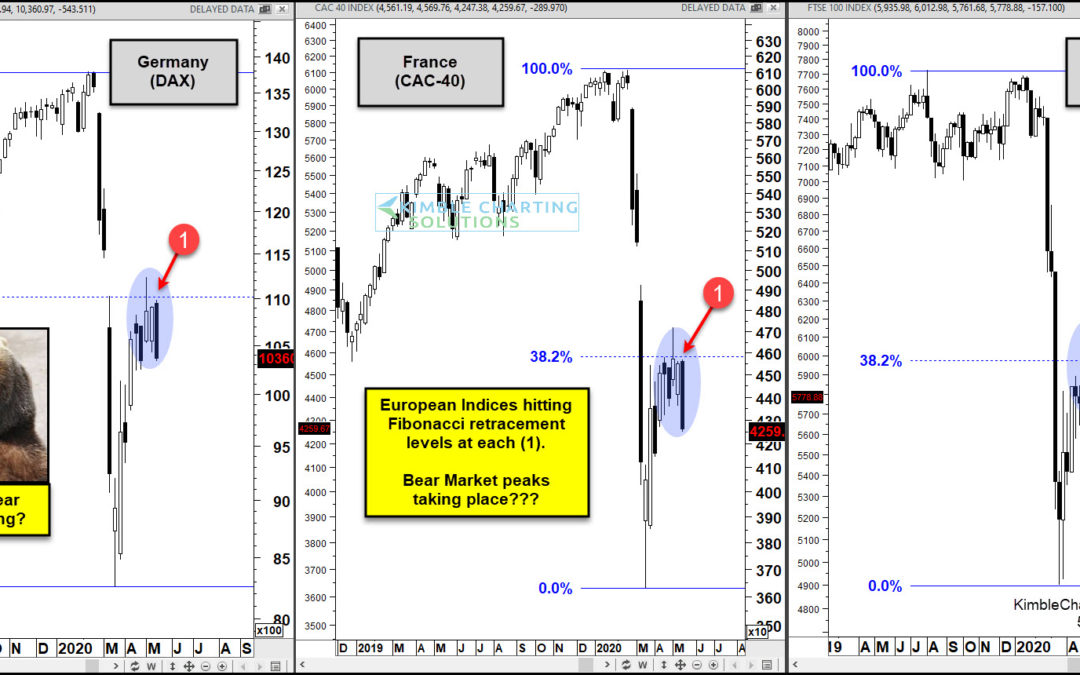
Are bear market rallies peaking in Europe? Very possible! This 3-pack looks at stock indices from Germany (DAX), France (CAC-40), and London (FTSE-100). Each index declined more than 20% from highs earlier this year, reflecting that each entered into bear markets....
by Chris Kimble | Apr 27, 2020 | Kimble Charting
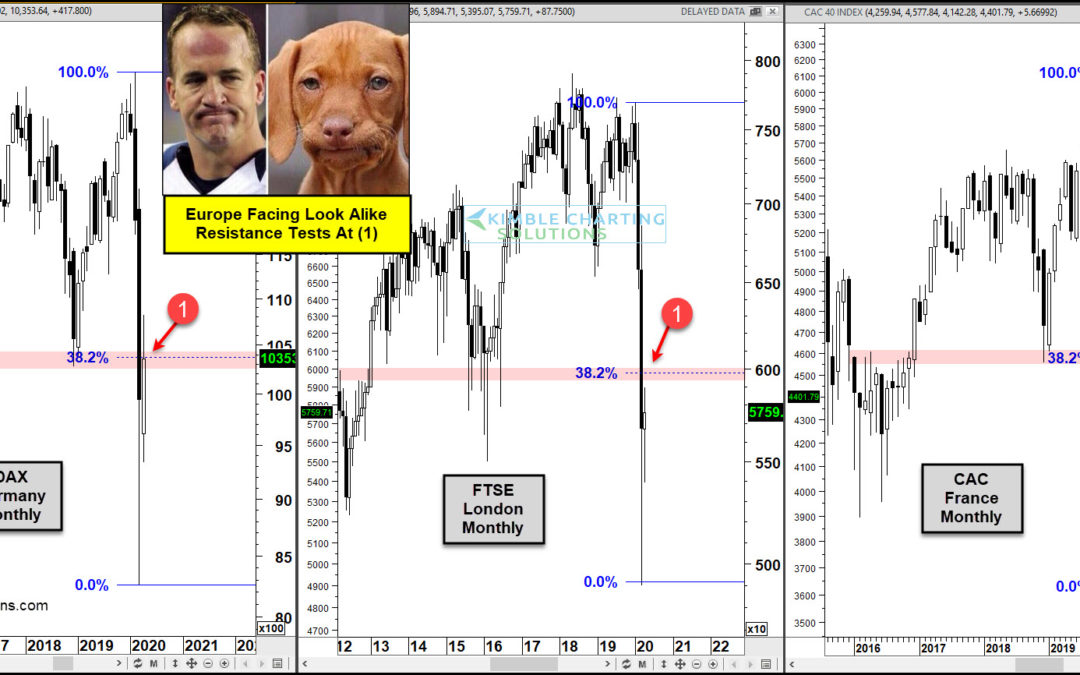
Major European Stock Indices have created “Look Alike” patterns of late. Could they be sending an important message to stocks around the world? Sure could be! The DAX( Germany), FTSE 100 (London), and the CAC 40(France) have reflected relative weakness...
by Chris Kimble | Apr 15, 2020 | Kimble Charting
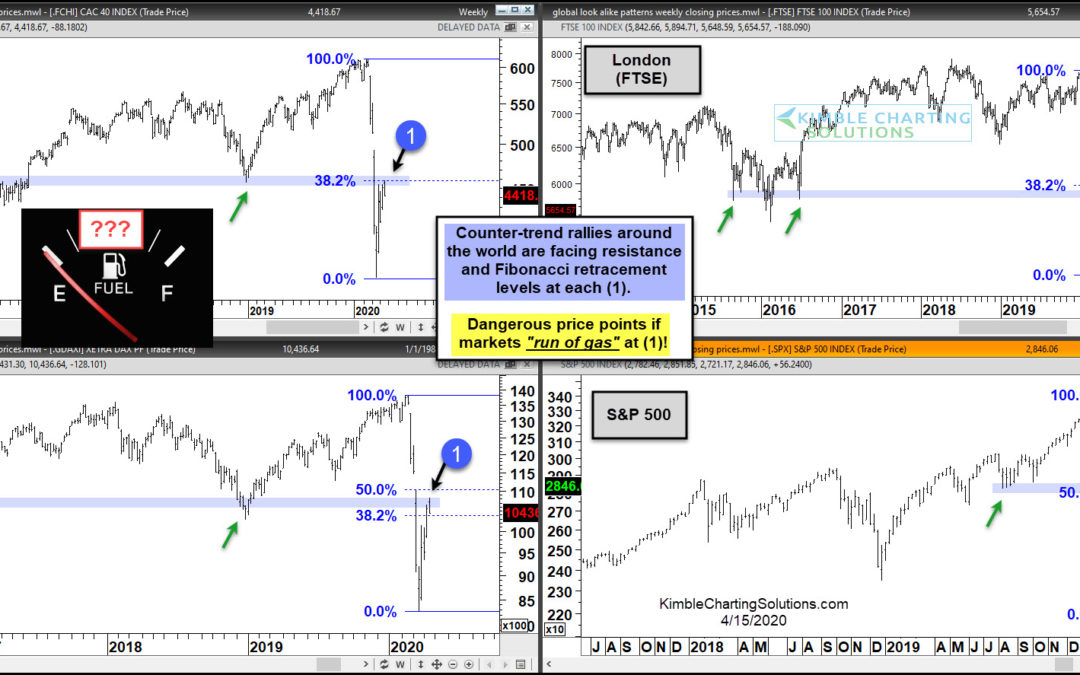
What goes up in a down market? Correlation! This 4-pack looks at patterns of Germany, London, France, and the States. No doubt each has been hit hard in the first quarter of 2020. All four have experienced counter-trend rallies, where each is facing multi-year...
by Chris Kimble | Jan 3, 2020 | Kimble Charting
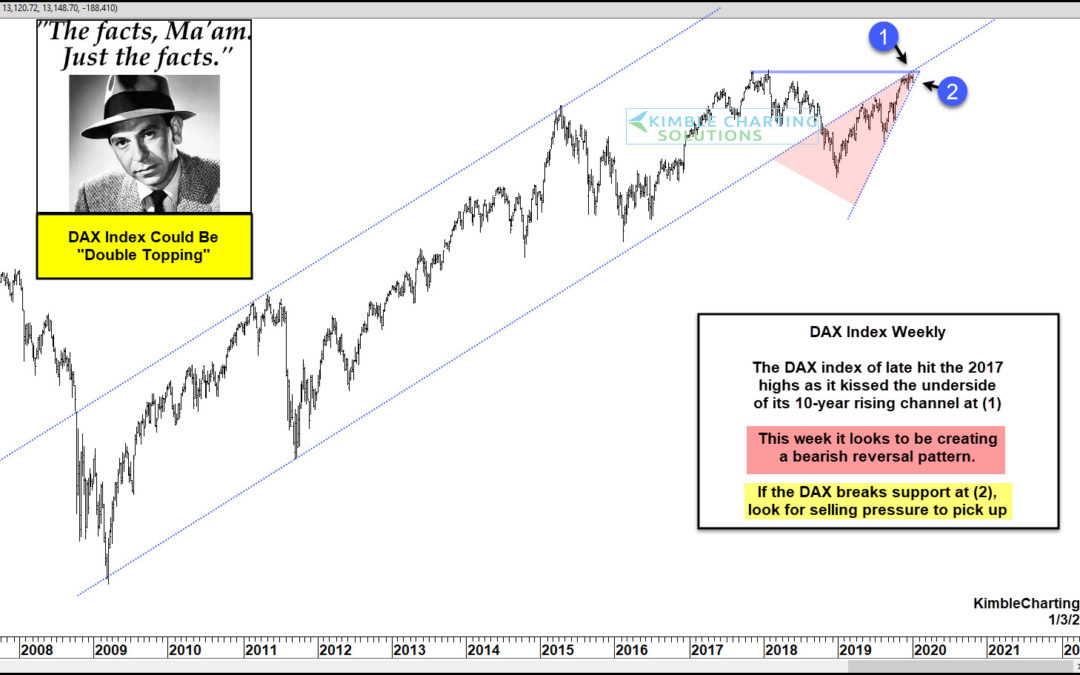
Could the DAX (Germany) be double topping as it kisses the underside of a 10-year rising channel? Possible The strong rally by the DAX over the past year, has it kissing the underside of its 10-year rising channel at (1). While kissing the underside of the channel it...
by Chris Kimble | Dec 2, 2019 | Kimble Charting
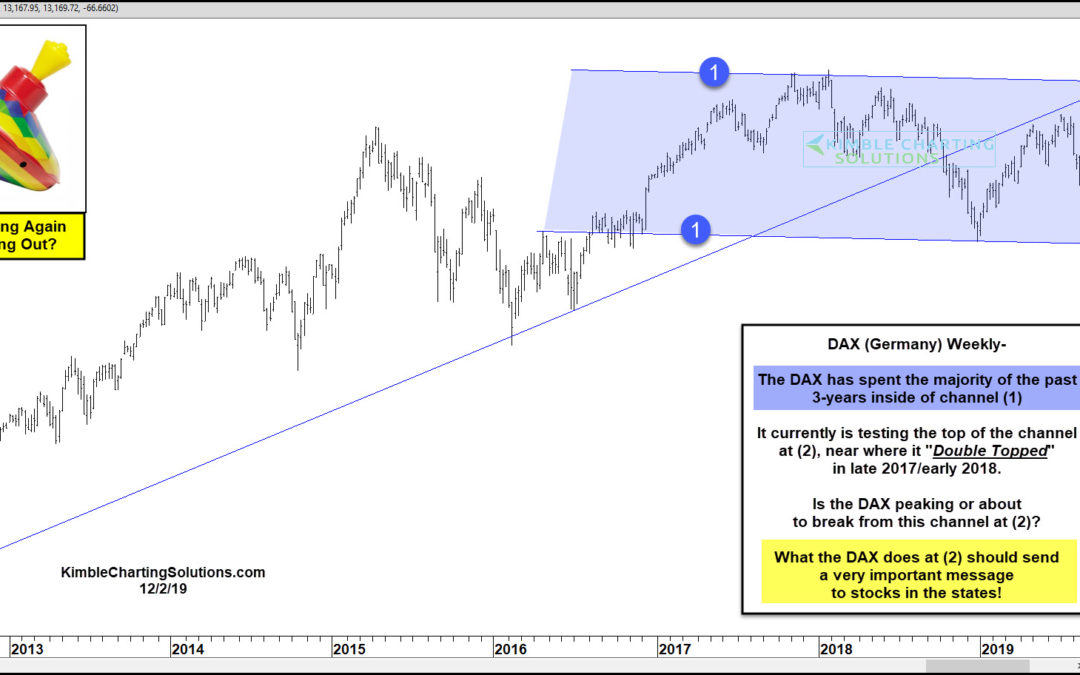
Is Germany about to send a very important price message to stocks in the states? This pattern would suggest it is! This chart looks at the DAX index from Germany over the past 7-years. As mentioned in the chart above, the DAX has spent the majority of the past 3-years...
by Chris Kimble | Jul 30, 2019 | Kimble Charting
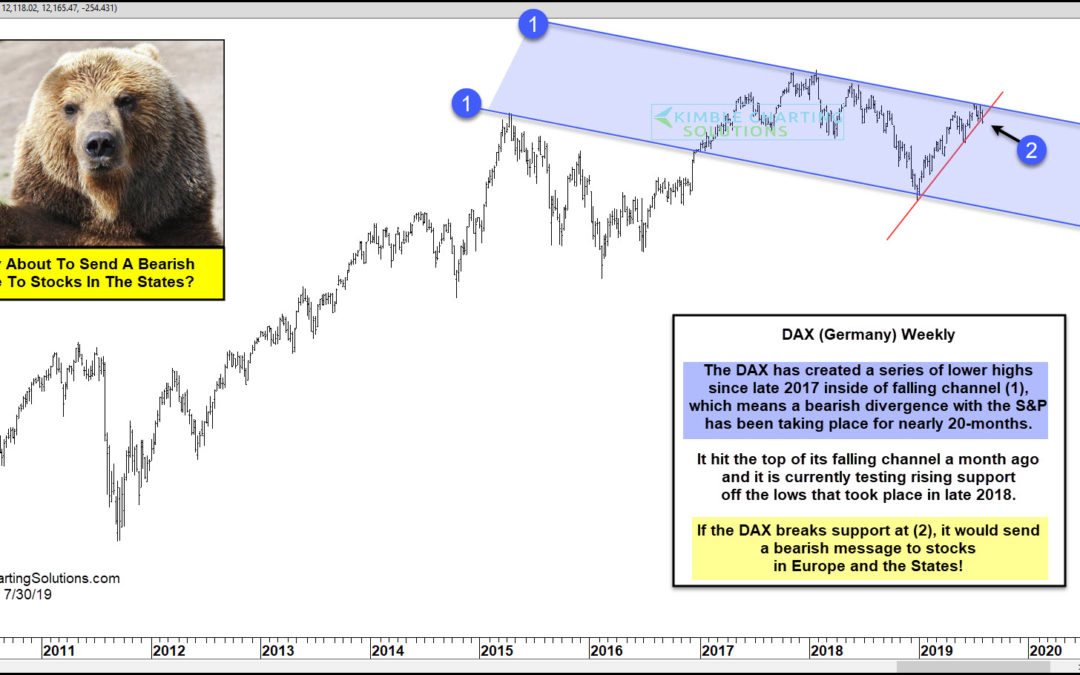
The DAX Index (Germany) has been experiencing a negative divergence to the S&P 500 for nearly 20-months? Could it be sending a negative message to stocks in the states in the near future? Possible! The DAX index has created a series of lower highs inside of...


