by Chris Kimble | Feb 29, 2024 | Kimble Charting
It is fair to say that the stock market has been lead higher by technology stocks and large cap stocks, in general. But two stock market indices that historically have been key to broad market rallies have under-performed: the small cap Russell 2000 Index and the...
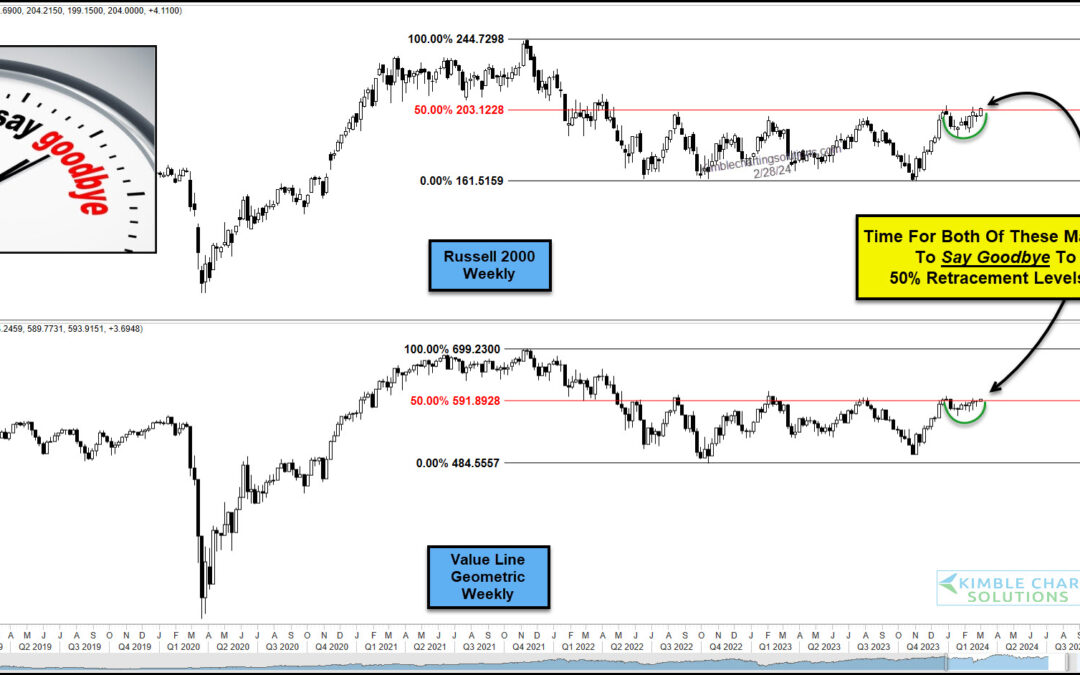
by Chris Kimble | Jan 8, 2024 | Kimble Charting
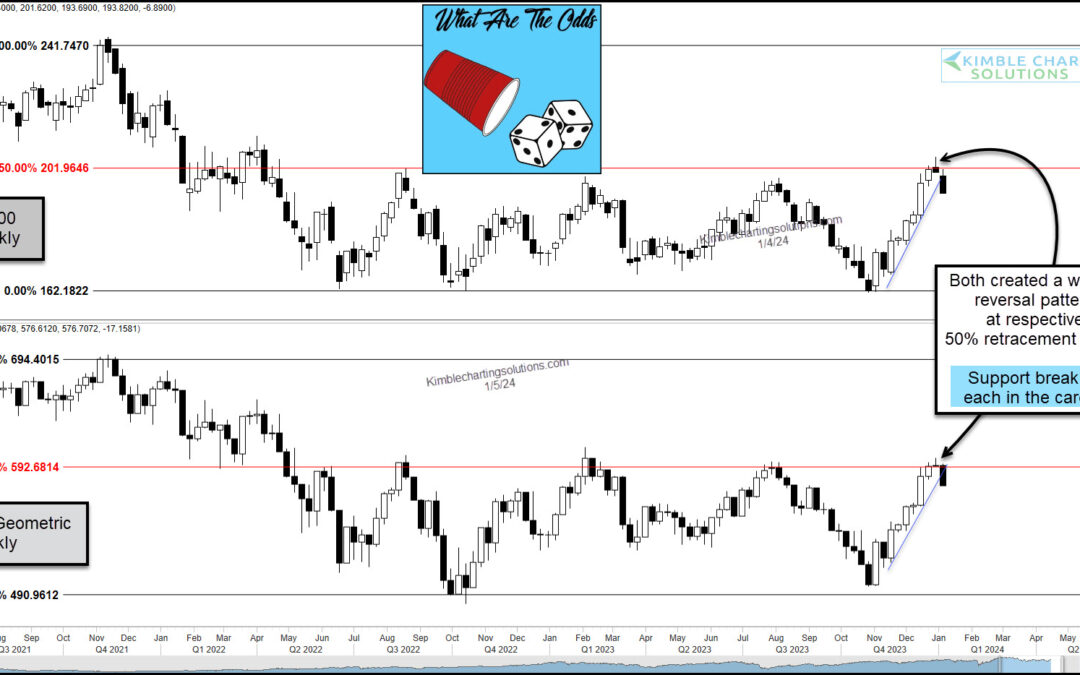
For the past two years, the Russell 2000 and Value Line Geometric Indexes have been lagging. Recently, however, both have come alive… adding a tailwind to the end of year rally. BUT these short-term rallies may be in trouble. Which also could mean that the broad...
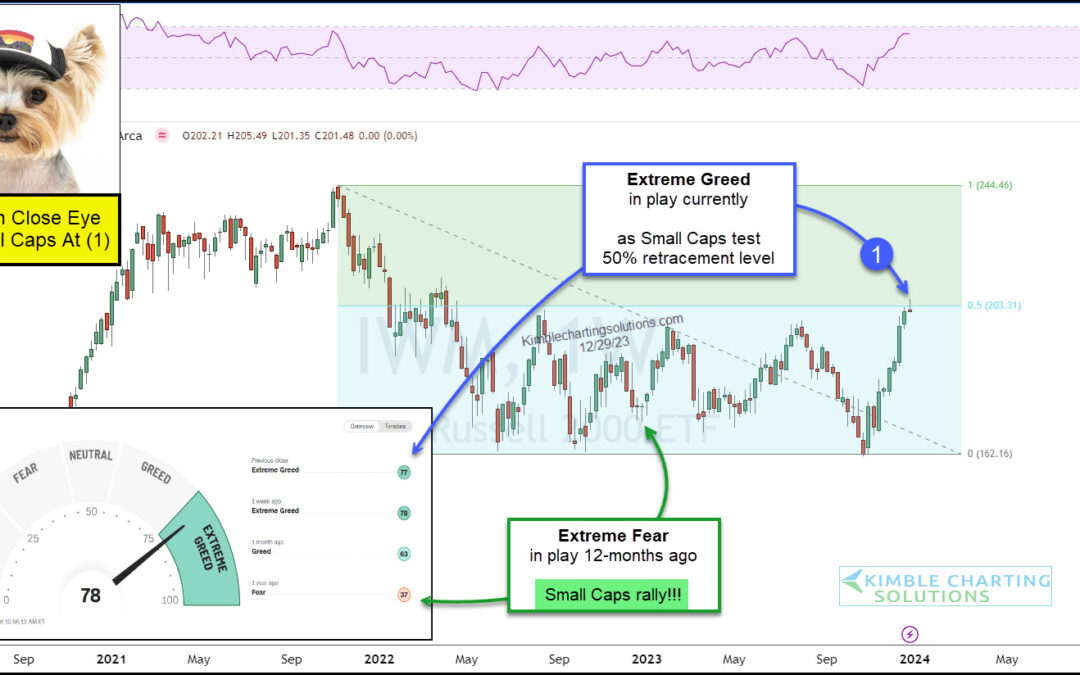
by Chris Kimble | Jan 3, 2024 | Kimble Charting
Small-caps stocks have been a noticeable laggard for over two years. But a recent year-end rally has set the Russell 2000 (IWM) on fire. Will this mark a change in performance in the future? Today’s chart of the Russell 2000 ETF (IWM) highlights its underperformance...
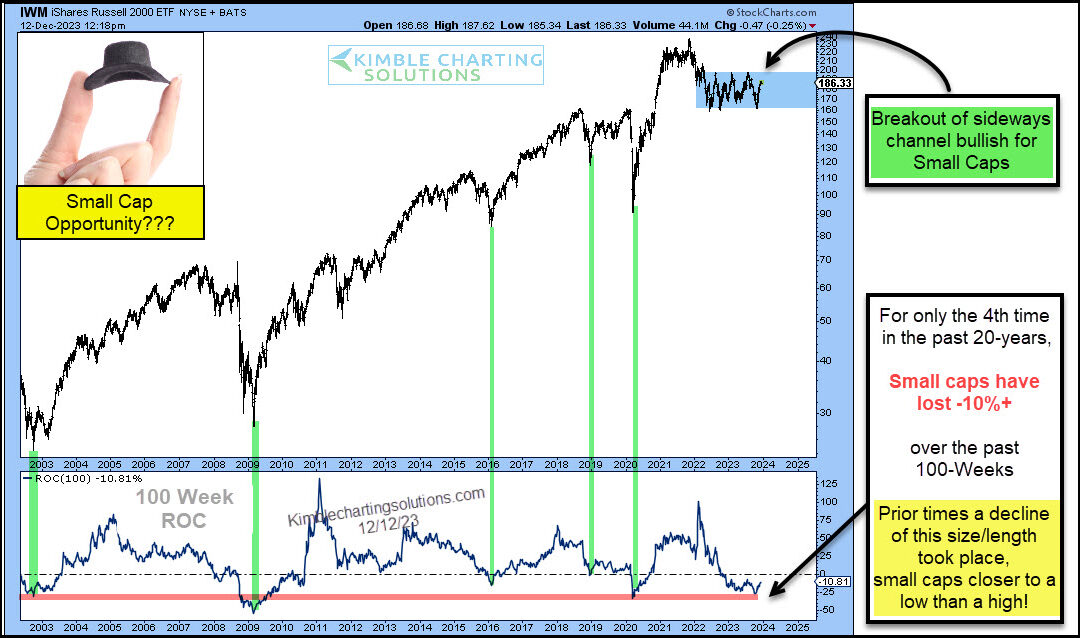
by Chris Kimble | Dec 13, 2023 | Kimble Charting
It is no secret that small-cap stocks have been out of favor. And underperforming! BUT lately, small-cap stocks have been in rally mode. So is there any reason for the recent buying? And could this continue? Today we look at a “weekly” chart of the Russell 2000 ETF...
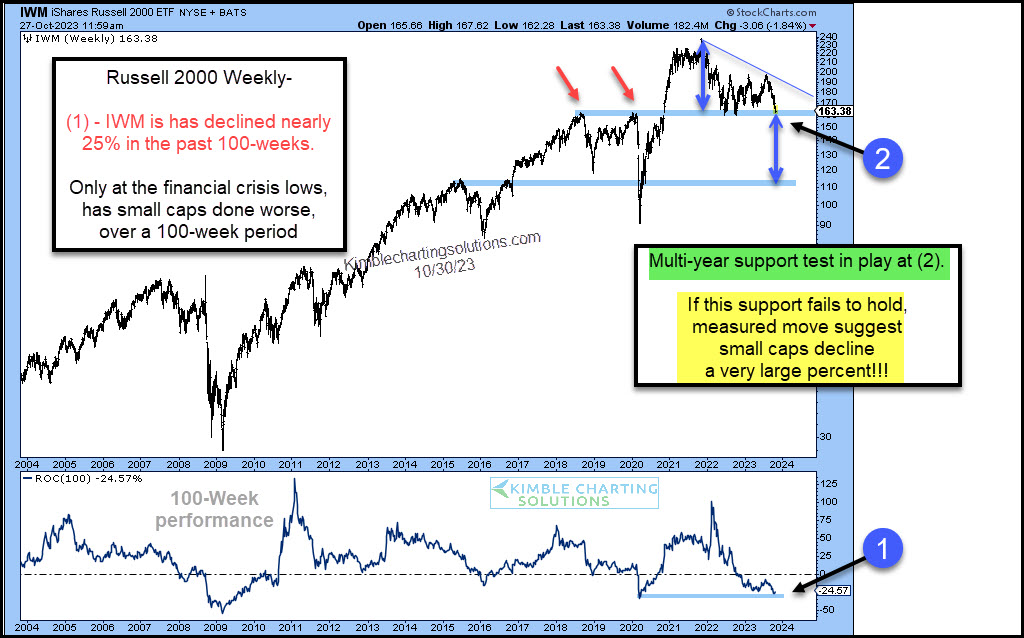
by Chris Kimble | Oct 31, 2023 | Kimble Charting
It’s been a dreadful past couple of years for the Russell 2000 and small cap stocks. Only in 2009 have small caps performed worse over a 100-week period – point (1) on today’s chart. Above we look at a long-term “weekly” chart to highlight some important technical...
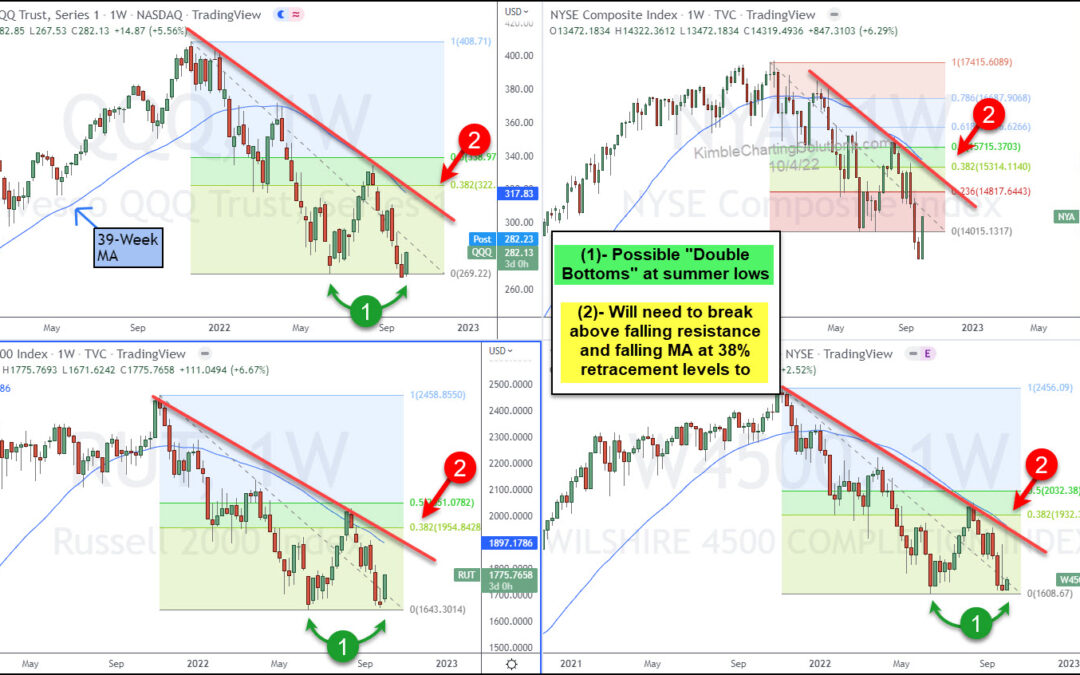
by Chris Kimble | Oct 6, 2022 | Kimble Charting
With stock markets in deep declines, traders need to stay cautious and adhere to their plans. As the same time, it is smart to identify potential technical patterns and what if scenarios to help identify potential trend changes. Today, we look at a chart 4-pack to...
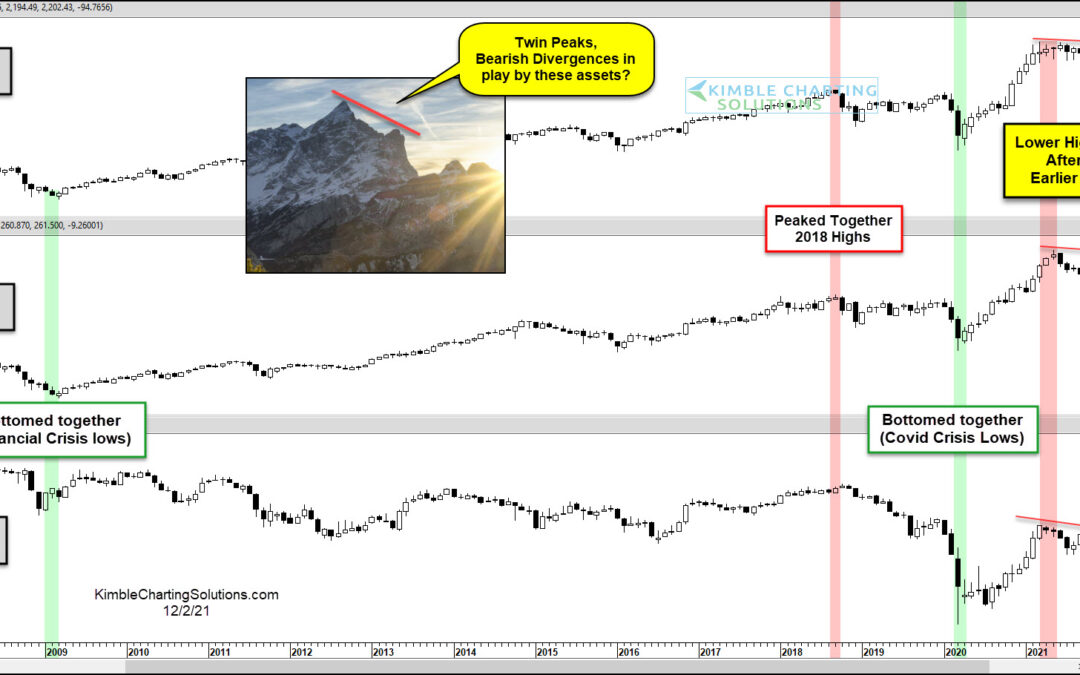
by Chris Kimble | Dec 2, 2021 | Kimble Charting
Uncertainty is mounting as the new omicron covid variant adds to economic concerns like inflation. This week, I shared an article looking at potential topping formations on the Transportation Sector (IYT) and small-cap Russell 2000 Index (IWM). Here we revisit these...
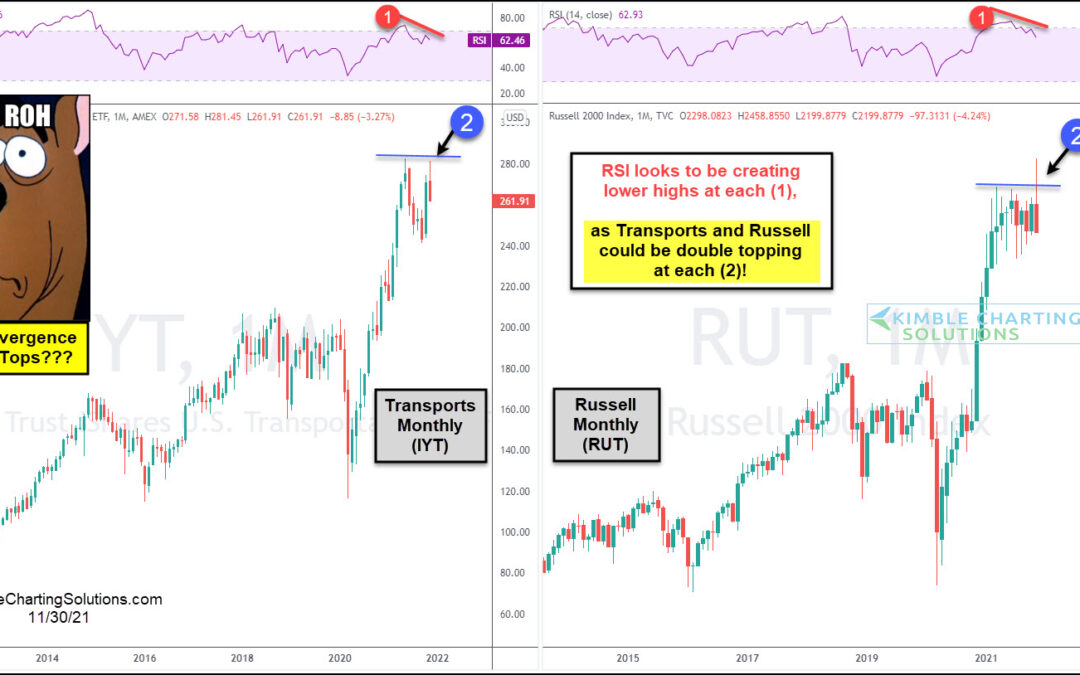
by Chris Kimble | Dec 1, 2021 | Kimble Charting
Two extremely important sectors to the economy and U.S. equities market are struggling. And investors should take notice. The Transportation Sector ETF (IYT) small cap Russell 2000 (IWM) are two sectors bulls would like to see continuing higher. But today’s long-term...
