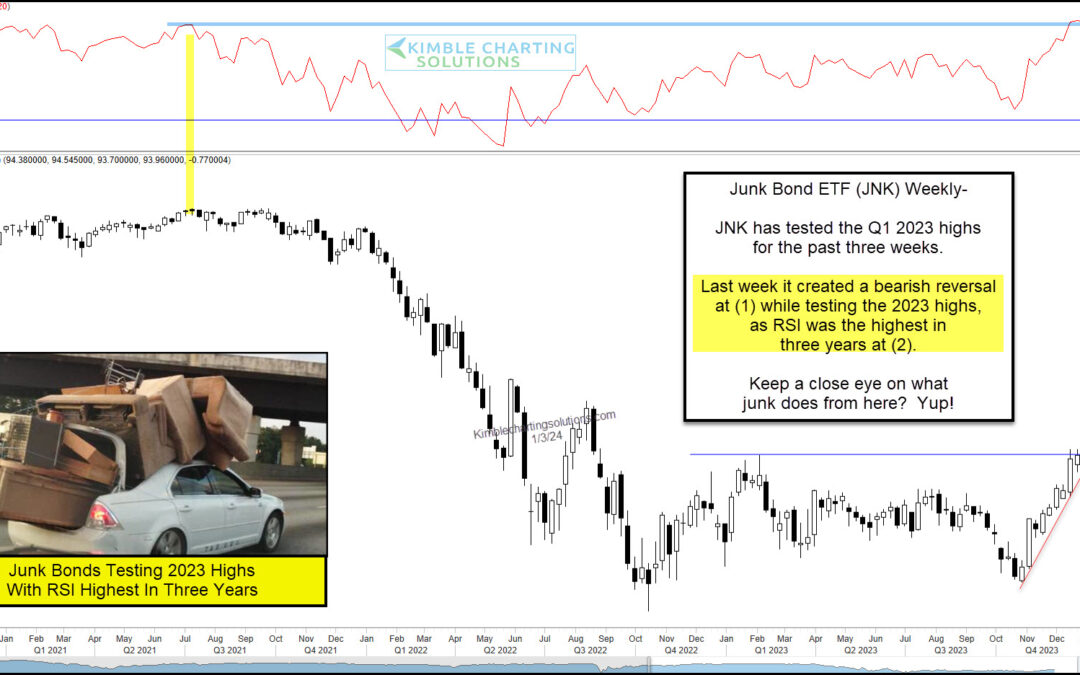
by Chris Kimble | Jan 3, 2024 | Kimble Charting
Several risk on indicators surged higher into year-end, such as small-cap stocks and junk bonds. And as we typically see, this coincided with a big year-end stock market rally. Today, we take a look at the Junk Bonds ETF (JNK) to see if this is sustainable into Q1 of...
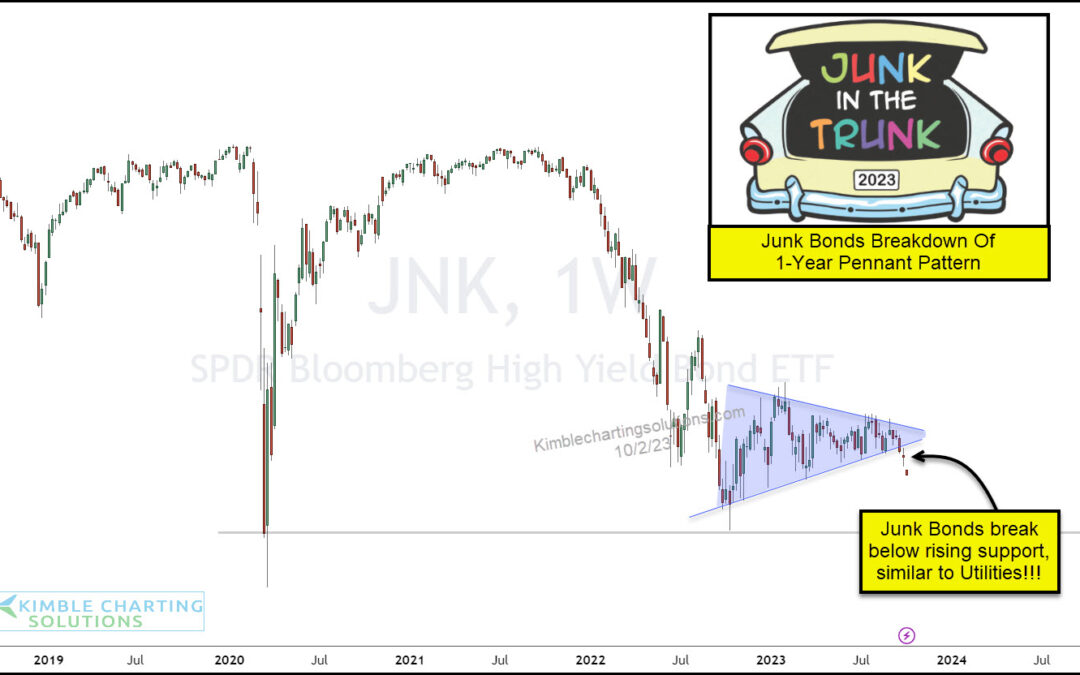
by Chris Kimble | Oct 3, 2023 | Kimble Charting
There are several indicators to watch when assessing risk across the financial markets, and today we discuss one of the more important ones. Junk bonds. When junk bonds are performing well and in demand, that is a sign of “risk-on”. But when they are under-performing,...
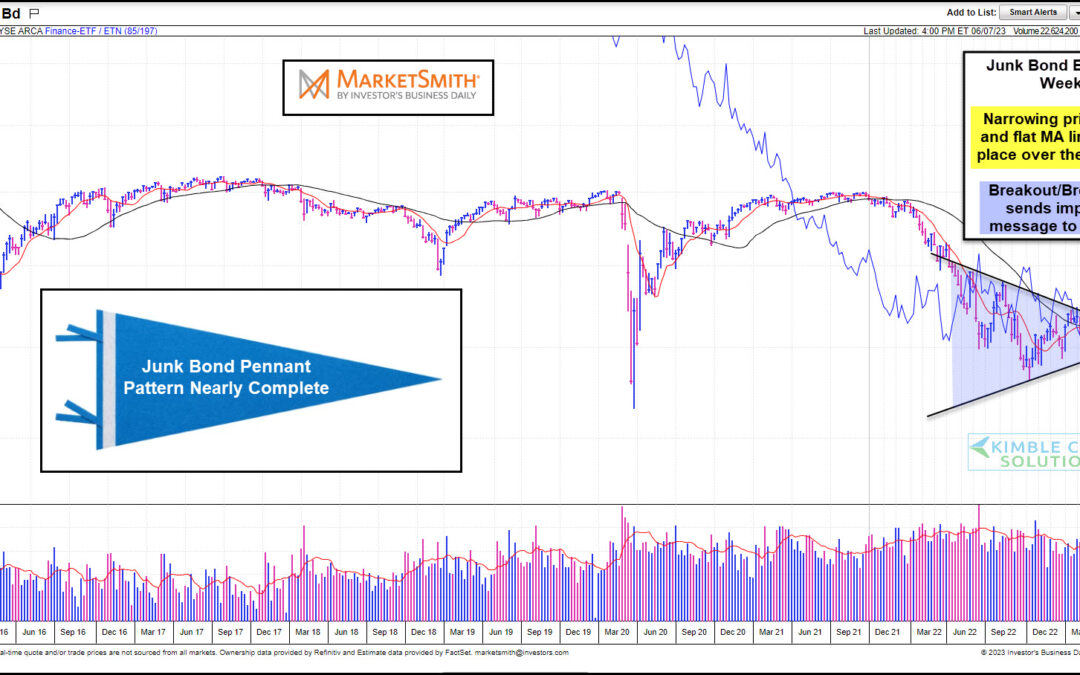
by Chris Kimble | Jun 12, 2023 | Kimble Charting
Successful traders and investors tend to watch junk bonds performance to understand when the financial market is bullish (junk bonds do well) versus when the market is bearish (junk bonds don’t do well). Today’s chart was created at Marketsmith.com Looking at...

by Chris Kimble | May 12, 2023 | Kimble Charting
The stock market is stuck in neutral, with several sectors failing to keep up. Call it a lack of leadership. One key sector that has really been struggling is banking. And let’s just say that the economy needs healthy banks and a healthy financial sector. Today’s...
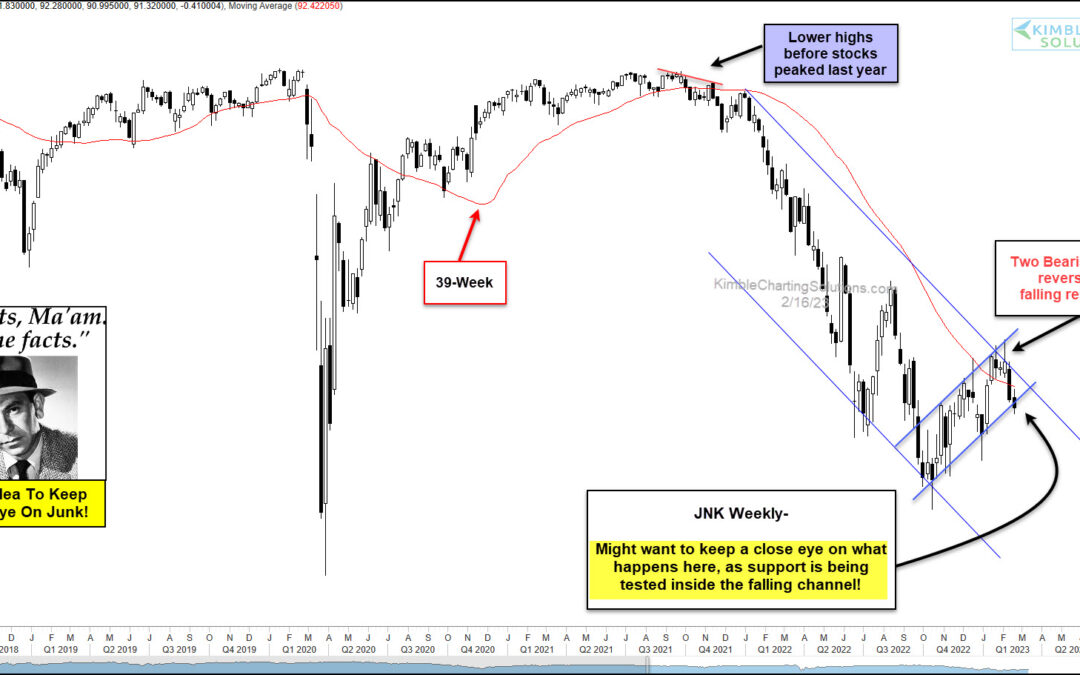
by Chris Kimble | Feb 17, 2023 | Kimble Charting
You will often hear us talk about the market giving “risk on” or “risk off” signals. In general, investors want to see “risk on” assets performing well. This includes tech stocks, growth stocks, small cap stocks, and high yield / junk bonds. Today, we focus on junk...
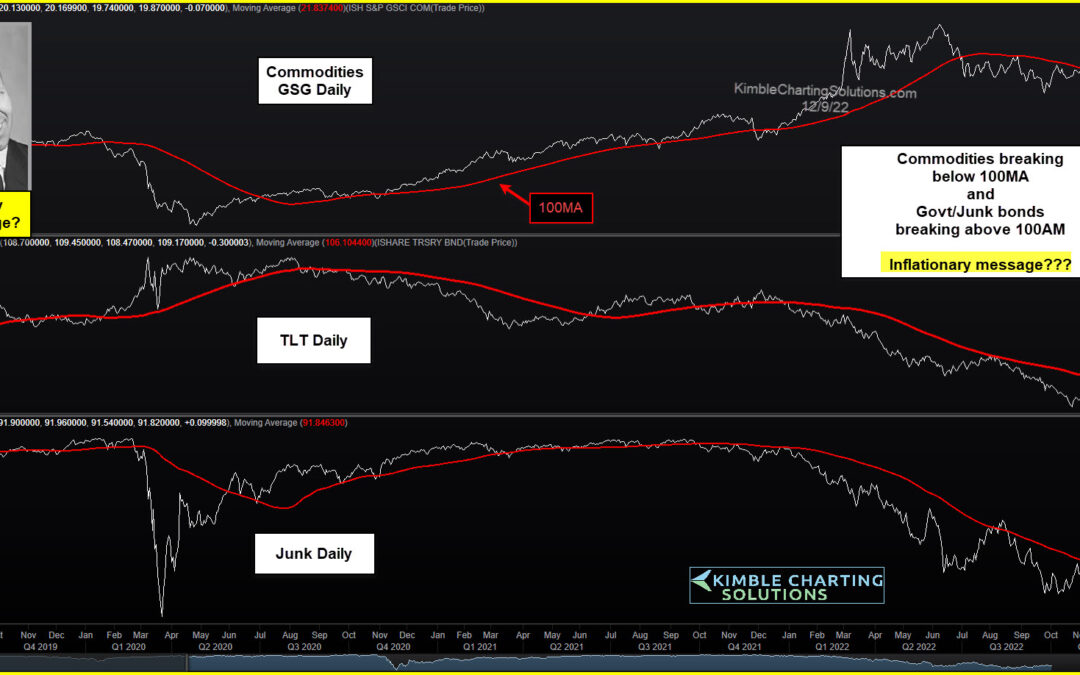
by Chris Kimble | Dec 13, 2022 | Kimble Charting
The financial markets have been volatile this year, to say the least. And much of the volatility has been tied to inflationary concerns and rising interest rates via the Federal Reserve. That said, we’ve come to a point in time where it appears that inflation may be...
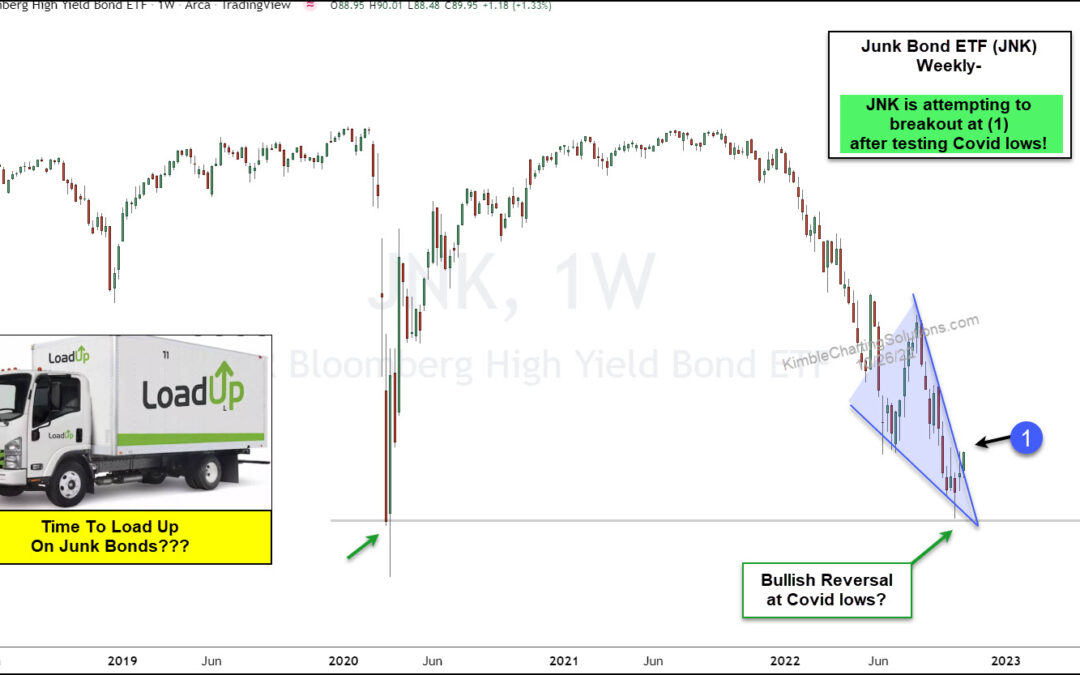
by Chris Kimble | Oct 28, 2022 | Kimble Charting
With yields trading at elevated levels and stocks trading at depressed levels, it makes sense that junk bonds are not faring well this year. BUT they are trying to re-group for a potential rally… and stock bulls would love to see risk-on “junk” rally. They have their...
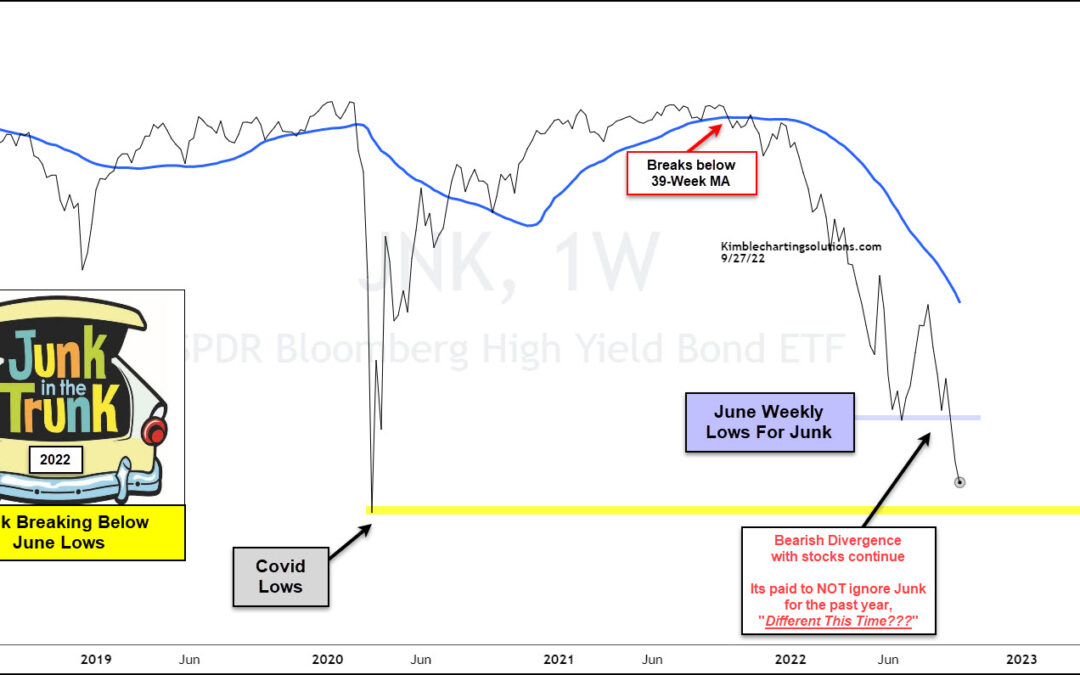
by Chris Kimble | Sep 29, 2022 | Kimble Charting
When stocks are showing weakness, we can learn a lot by watching the credit markets. And in today’s case, Junk Bonds and the ETF $JNK. Better yet, today we share 2 charts to better illustrate was is happening in the broader markets. The first chart is the Junk Bonds...
