by Chris Kimble | Mar 5, 2024 | Kimble Charting
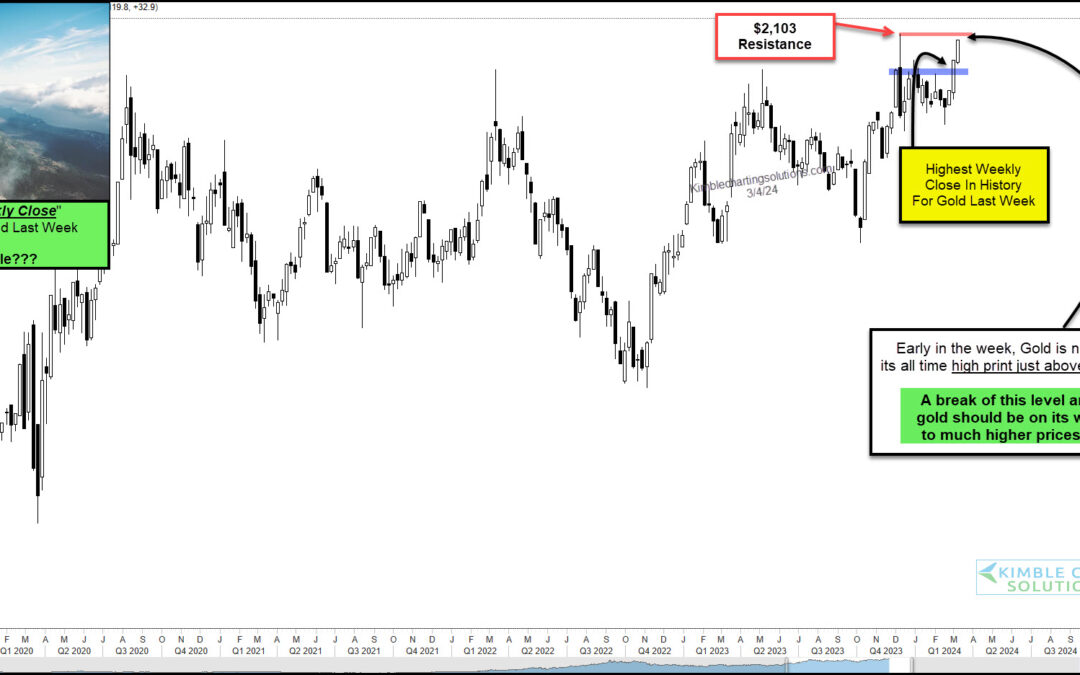
Precious metals may finally be nearing the rally that gold and silver bulls have been waiting for. Today, we simply focus on Gold from a “weekly” price perspective. And let’s just say that the recent price action has been bullish. Last week, Gold closed at its...
by Chris Kimble | Oct 18, 2023 | Kimble Charting
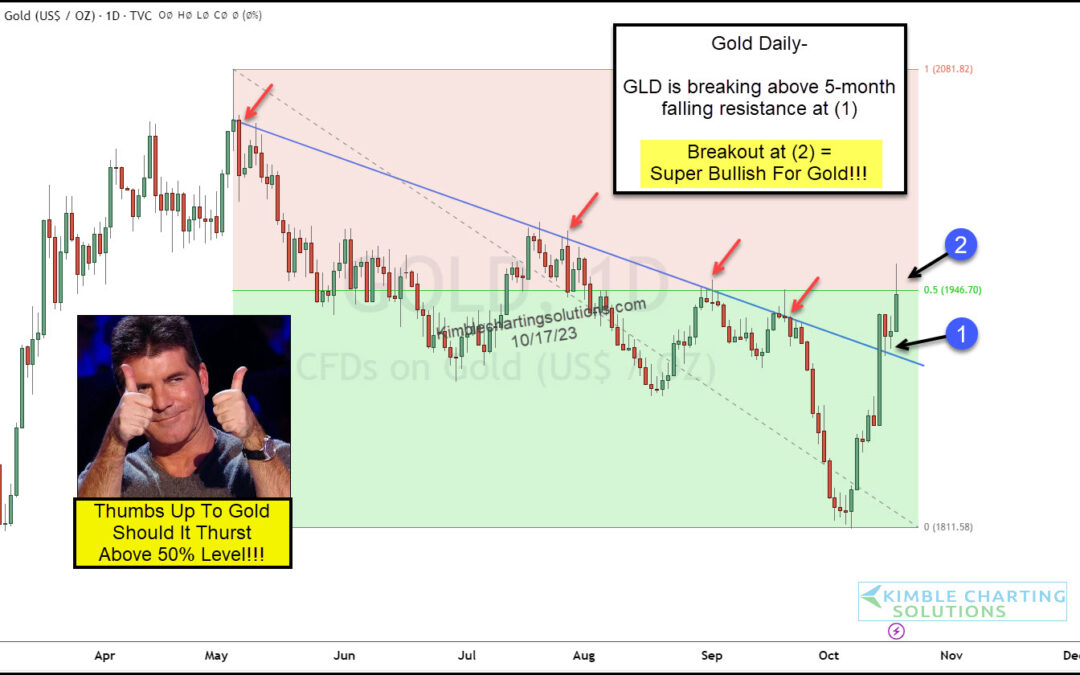
Gold prices have bounced around during a volatile multi-month pullback. Each rally has been met with more selling. Could that be changing soon? Today’s “daily” chart of the Gold Futures shows price breaking above its 5-month down-trend line at (1). This is good news...
by Chris Kimble | May 24, 2023 | Kimble Charting
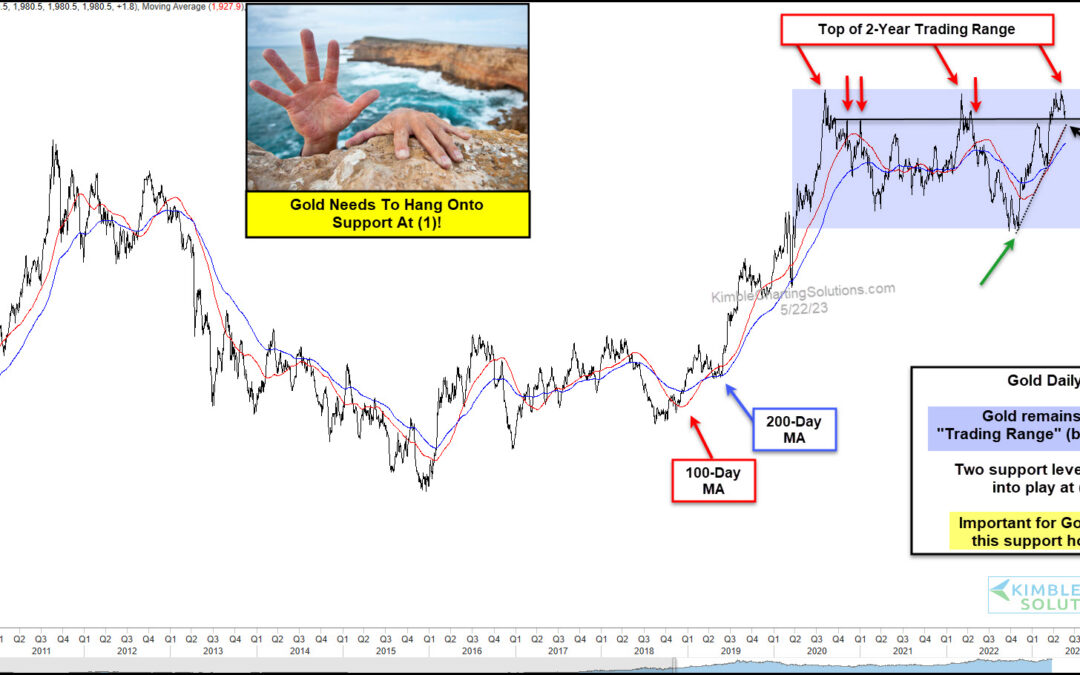
There’s so much uncertainty today that I think the markets are uncertain about being uncertain. I know Gold is sure trading like it. With so much uncertainty in the world today, it’s not surprising that Gold prices remain elevated. But each time it looks like a...

by Chris Kimble | May 10, 2023 | Kimble Charting
The precious metals sector has remained elevated, yet volatile, over the past two years. Call it consolidation, but in my humble opinion, something has got to give. Inflation, war, politics… gold bulls have the catalysts and tailwinds to see higher prices. Today, we...
by Chris Kimble | Dec 5, 2022 | Kimble Charting
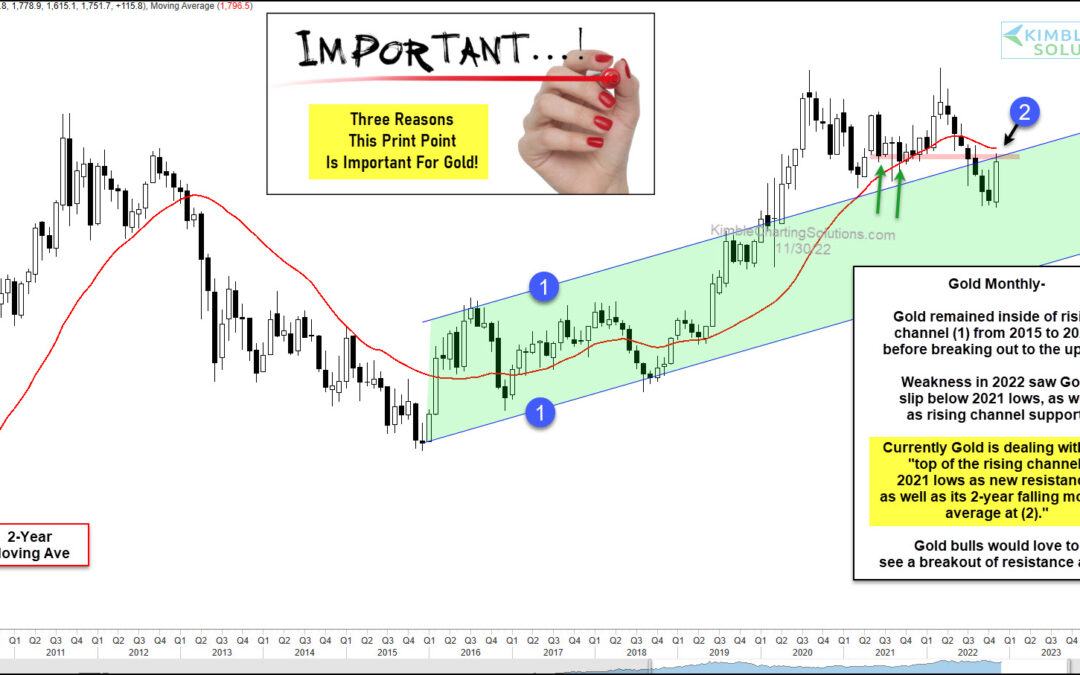
Gold started to perk up over the past month, finishing November on a very strong note. But, there is much more going here. Gold finished at a key price resistance level… and not just any old resistance level. Today’s long-term “monthly” chart of Gold futures...
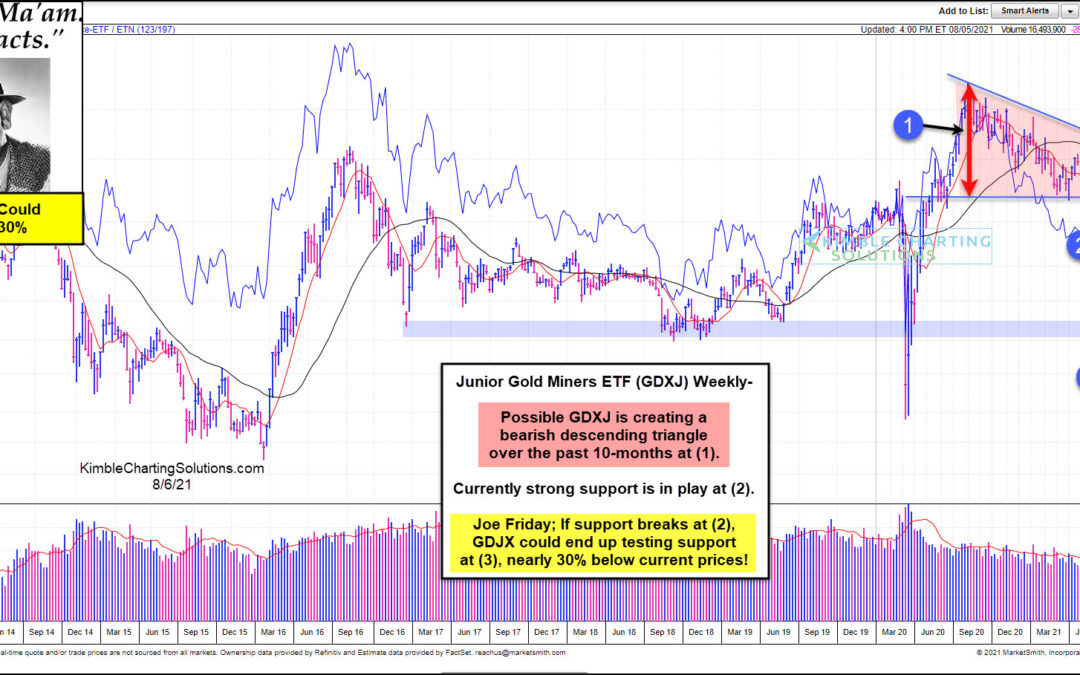
by Chris Kimble | Aug 6, 2021 | Kimble Charting
This chart comes from Marketsmith.com, which looks at Junior Gold Miners ETF (GDXJ). This chart highlights that GDXJ could be creating a bearish descending triangle over the past 10-months at (1). Currently, GDXJ is testing an important support line at (2). Joe Friday...
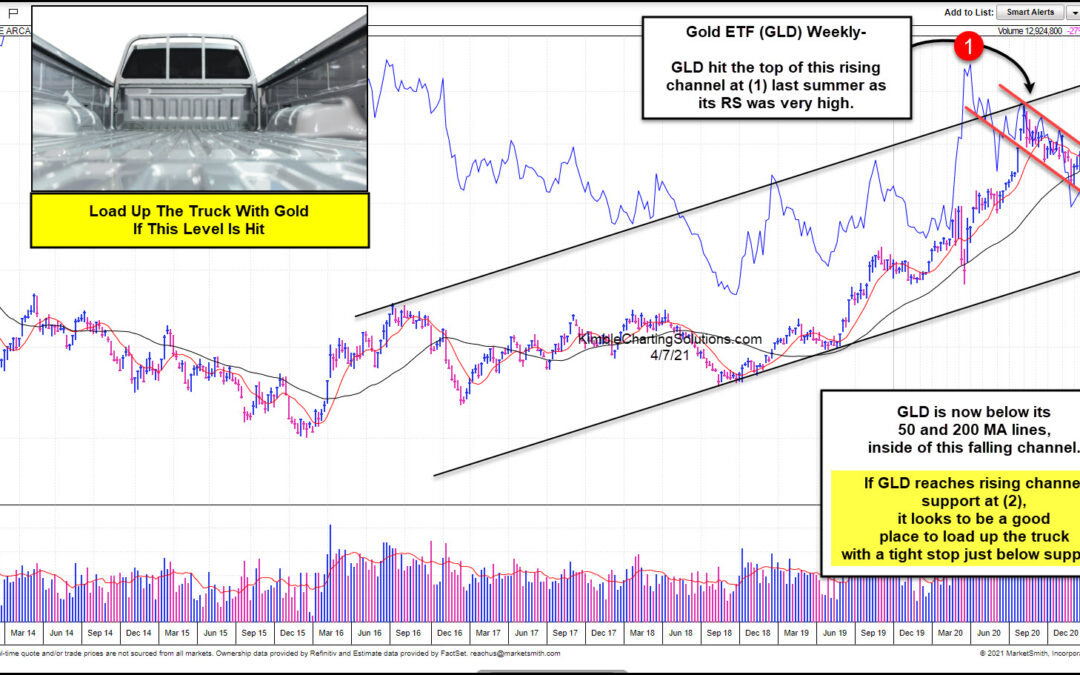
by Chris Kimble | Apr 7, 2021 | Kimble Charting
Gold has created lower highs since peaking last summer. Is Gold near a low? Where would a nice entry point come into play? This chart looks at Gold ETF (GLD) on a weekly basis over the past few years. GLD hit the top of this rising channel at (1) last summer, as it...
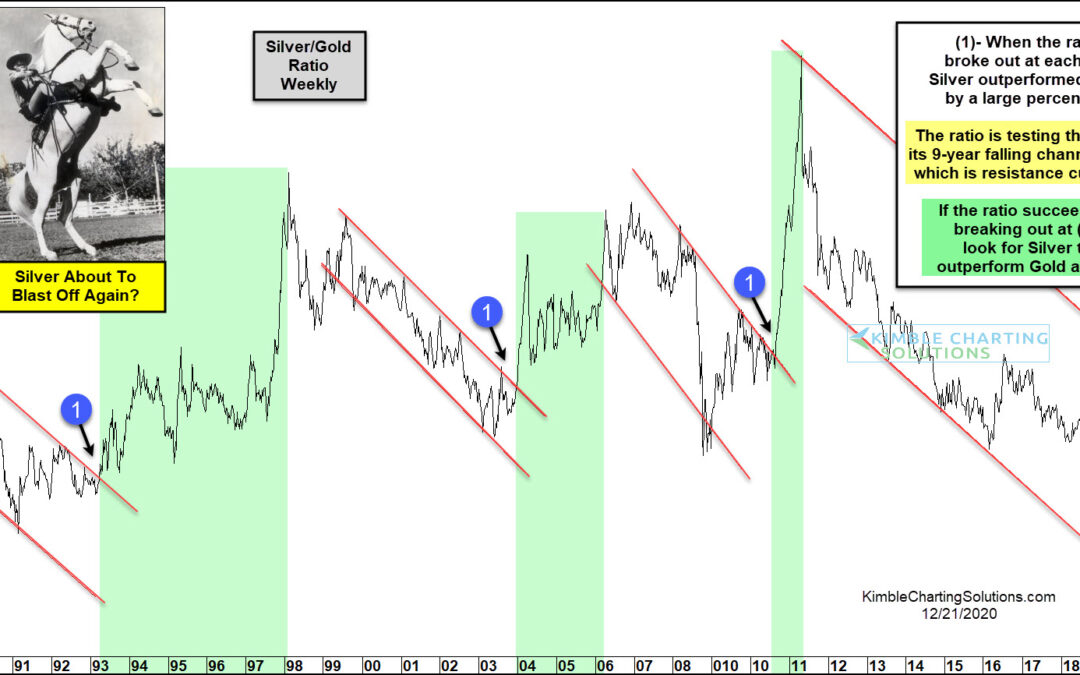
by Chris Kimble | Dec 21, 2020 | Kimble Charting
Precious metals are having a strong year in 2020. So is it any surprise that Silver has been leading Gold higher? As I’ve said before, Silver is to precious metals what small-cap stocks are to the broad market… it’s always beneficial when they lead In today’s chart...
